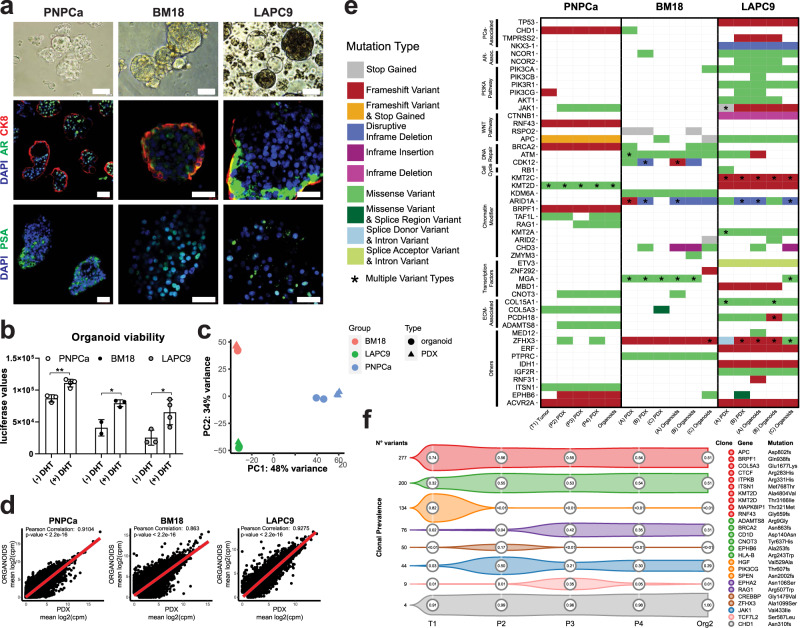
Fig. 2. Mutational landscape of PDX and PDX-derived organoids from PNPCa, and advanced androgen (in) dependent BM18 and LAPC9 models.
a Morphology of PNPCa, BM18, and LAPC9 PDX-derived organoids; brightfield images, whole mount immunofluorescence staining and 3D projection of z-stack of organoids stained for PSA, AR, and CK8. DAPI marks the nuclei. Scale bars 50 μm. b Viability assay of organoids derived from PNPCa, BM18, and LAPC9 tumor tissues and exposed to dihydrotestosterone (±DHT) for 48 h. Luciferase values (ATP release) are proportional to cell viability. Mean ± SD is reported, N = 3,4 technical replicates per condition (PNPCa), N = 2,3 technical replicates per condition (BM18), N = 3,4 technical replicates per condition (LAPC9). Two-tailed t-test, *p = 0.0161, p = 0.0277, **p = 0.0031. c Principal component analysis of the gene expression of the 1000 most variable genes on PNPCa, BM18, and LAPC9 samples (PDX and PDX-derived organoids). d Correlation plots of gene expression between PNPCa PDX tissue (N = 3 biologically independent tumor samples) and organoids (N = 2 biologically independent organoid samples), BM18 PDX tissue (N = 2) and organoids (N = 2), LAPC9 PDX tissue (N = 2) and organoids (N = 2), p-values < 2.2e10−16. e Somatic mutation analysis of WES of tissue and organoids of PNPCa, BM18, and LAPC9 PDX. Columns represent different samples, while rows represent selected genes categorized by pathway. Types of genetic aberrations are indicated in different colors. Multiple types of mutations per gene are indicated with an asterisk. A–C indicate biological replicates. f Clonality analysis of the PNPCa samples shown in e, inferred by PyClone. Only the largest clones (consisting of most variants) or those containing cancer genes are shown. Numbers in circles indicate mean clonal prevalence, estimated for each sample. Mutations in cancer genes corresponding to each clone are reported on the left and color-coded. Overall, most mutations (including those in cancer genes) occur at high prevalence in all samples (top two clones). WES, whole-exome sequencing.

