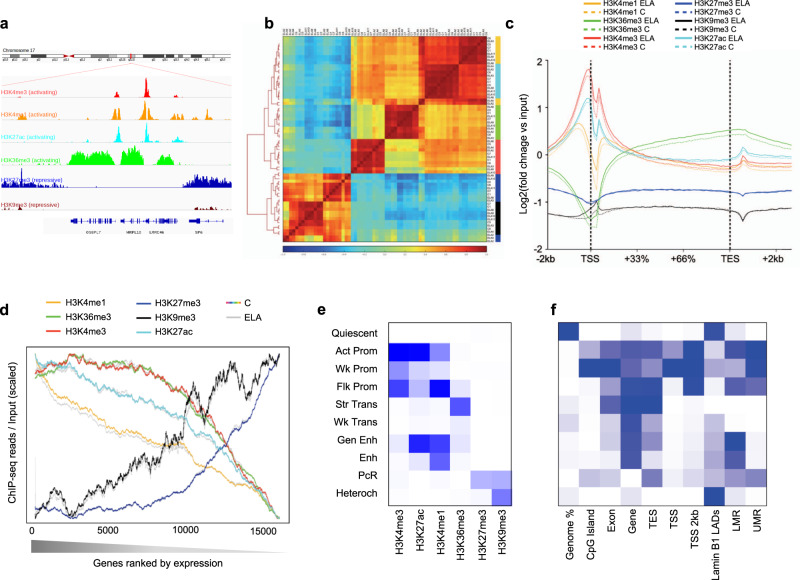
Fig. 1. Characterization of six histone post-translational modifications in the human brain lateral amygdala.
a Snapshot of typical ChIP-seq read distribution for the six histone marks. b Unsupervised hierarchical clustering using Pearson correlations for all marks. Correlations were computed using read number per 10 kb-bins across the whole genome and normalized to input and library size. Note the expected separation between activating (H3K27ac, H3K36me3, H3K4me1, H3K4me3) and repressive (H3K27me3, H3K9me3) marks. c Average enrichment over the input of ChIP-seq reads across all gene bodies and their flanking regions (+/− 2 kilobases, kb) in the human genome, for each histone mark. Note the expected biphasic distribution of reads around the TSS for H3K27ac, H3K4me3, and H3K4me1. No significant differences were observed for any mark across C and ELA groups (two-sided two-way repeated-measures ANOVA, group effects: H3K4me1, P = 0.89; H3K36me3, P = 0.87; H3K4me3, P = 0.64; H3K27me3, P = 0.35; H3K9me3, P = 0.88; H3K27ac, P = 0.86). Averages for the healthy controls group (C) are shown as dashed lines, while averages for the early-life adversity group (ELA) are shown as solid lines. d Average enrichment of reads over gene bodies (for H3K27me3, H3K36me3, H3K4me1, and H3K9me3) or TSS + /− 1 kb (for H3K27ac and H3K4me3) for all genes ranked from most highly (left) to least (right) expressed. Strongly significant effects of gene ranking on ChIP-Seq reads were observed for all marks (P < 0.0001). Again, no difference was observed as a function of ELA for any group (two-sided two-way repeated-measures ANOVA, group effects: H3K4me1, P = 0.66; H3K36me3, P = 0.67; H3K4me3, P = 0.98; H3K27me3, P = 0.31; H3K9me3, P = 0.74; H3K27ac, P = 0.48). e ChromHMM emission parameters (see main text and “Methods”) for the 10-state model of chromatin generated using data from the six histone marks, at a resolution of 200 bp, as described previously16. Maps of chromatin states have already been characterized in other brain regions (e.g., cingulate cortex, caudate nucleus, substantia nigra49) but, to our knowledge, not in the amygdala. f Intersections of chromatin states with gene features (from RefSeq) and methylomic features (lowly methylated and unmethylated regions, LMR and UMR, defined using methylseekR; see “Methods”) were computed using chromHMM’s OverlapEnrichment function. As expected, CpG-dense UMRs mostly overlapped with Promoter chromatin states, while LMRs associated with more diverse chromatin states, including Enhancers (Fig. 1f and Supplementary Fig. 10a), consistent with their role as distant regulatory sites31. Act-Prom active promoter, Enh enhancer, Flk-Prom flanking promoter, Heterochr heterochromatin, LADs lamina-associated domains, PcR polycomb repressed, Str-Enh strong enhancer, Str-Trans strong transcription, TES transcription end site, TSS transcription start site, Wk-Prom weak promoter, Wk-Trans weak transcription. Source data are provided as a Source Data file.

