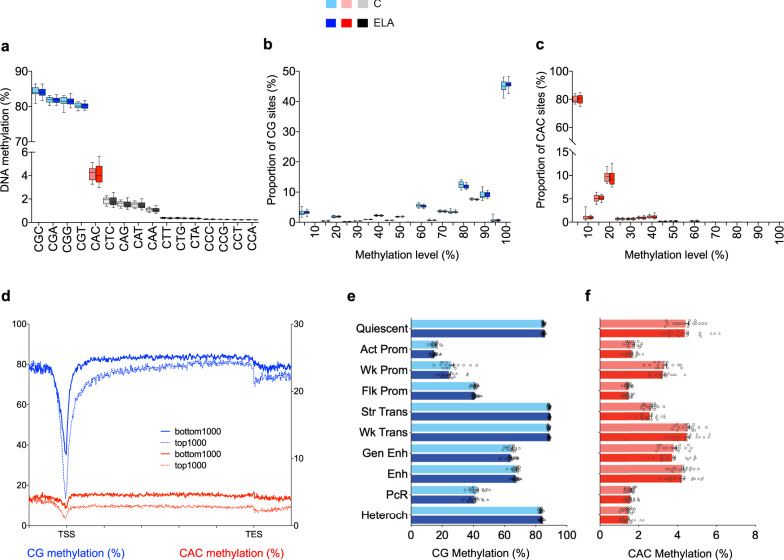
Fig. 2. Characterization of non-CG methylation in the human brain lateral amygdala.
a Average genome-wide levels of DNA methylation were measured among the sixteen three-letter cytosine contexts (CNN, where N stands for any base) in the human brain lateral amygdala, using whole-genome bisulfite sequencing. While highest DNA methylation levels were observed in the four CGN contexts (CGC: 84.1 ± 0.2%; CGA: 81.9 ± 0.1%; CGC: 81.4 ± 0.2%, CGT: 80.2 ± 0.1%; mean ± sem in the whole cohort), detectable non-CG methylation was also observed in CHN context (where H stands for A, C, and T), most notably at CAC sites (4.1 ± 0.1% in combined control, C, and early-life adversity, ELA, groups; n = 38 subjects total), with no detectable differences between groups for any context (two-way repeated-measures ANOVA; group effect: [F(1,36) = 0.12; P = 0.73]). b DNA methylation in the CG context mostly corresponded to highly methylated sites. In contrast, as previously described in the mouse hippocampus29, most CAC sites were unmethylated (c), with only a minority of them showing low methylation levels, between 10 and 20% (n = 38 subjects). This likely reflects the fact that non-CG methylation does not occur in all cell types, and is notably enriched in neuronal cells and, to a lesser extent, in glial cells11. In the CG or CAC contexts (two-way ANOVA; group effect: CG, [F(1,720) = 5.0E-11; P > 0.99]; CAC, [F(1,36) = 0; P > 0.99]), ELA did not associate with any significant change in these global distributions. Box plots show median and interquartile range, with whiskers representing minimum and maximum values. d In both contexts, patterns of DNA methylation along gene bodies showed the expected anti-correlation with gene expression, as shown here comparing 1000 most highly (top 1000) or lowly (bottom 1000) expressed genes, consistent with previous rodent data. In the CG (e) or CAC (f) contexts, no difference in DNA methylation levels was observed between C and ELA groups for any chromatin state (values are mean ± sem in each C or ELA group; n = 17 and 21 subjects, respectively). We observed, however, dissociations in the relationship of DNA methylation and histone marks across the CG and CAC contexts (see main text). Values are mean ± sem. Act-Prom active promoter, Enh enhancer, Flk-Prom flanking promoter, Heterochr heterochromatin, PcR polycomb repressed, Str-Enh strong enhancer, Str-Trans strong transcription, TES transcription end site, TSS transcription start site, Wk-Prom weak promoter, Wk-Trans weak transcription. Source data are provided as a Source Data file.

