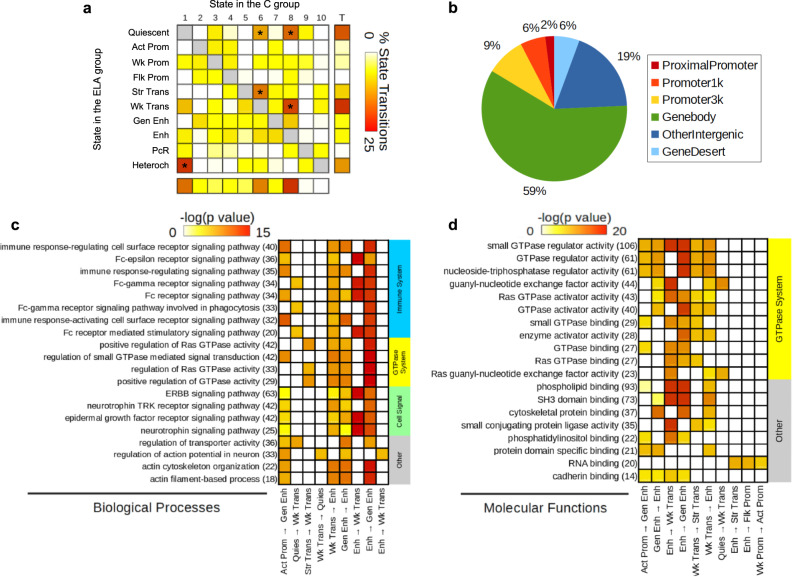
Fig. 4. Analysis of genomic sites showing a switch between chromatin states as a function of early-life adversity (ELA).
a Percentage of each state transition (ST) type relative to the total number of transitions. For the healthy control (C) versus ELA group comparison, the cumulative percentages of ST from a specific state to any other state are shown in the “Total” and “T” rows/columns. * indicates most frequent STs (see main text). b Distribution of ST localizations relative to genomic features, assessed using region_analysis34 (see “Methods”). c, d Gene ontology “Biological Processes” (c) or “Molecular Functions” (d) terms significantly associated with at least three types of ST (for each ST type, each GO term met the following criteria: fold change ≥ 1.5 and FDR-q ≤ 0.1, for both hypergeometric and binomial tests). Terms are grouped based on the overall system involved and ranked by co-occurrence score (in parentheses after each term), which reflects both their significance and their recurrence across multiple ST (see main text and ref. 35). Individual binomial P values for each type of ST and each term are shown by the color gradient. Immune-related and small GTPase terms were most strongly affected, across multiple ST. Of note, a complementary GREAT pathway analysis using MSigDB further strengthened these findings by revealing recurrent enrichment of the integrin signaling pathway (across six types of ST, as well as for H3K27ac down DS; see Supplementary Fig. 12c), which is known to interact extensively with small GTPases98. Act-Prom active promoter, Enh enhancer, Flk-Prom flanking promoter, Heterochr heterochromatin, PcR polycomb repressed, Str-Enh strong enhancer, Str-Trans strong transcription, Wk-Prom weak promoter, Wk-Trans weak transcription. Source data are provided as a Source Data file.

