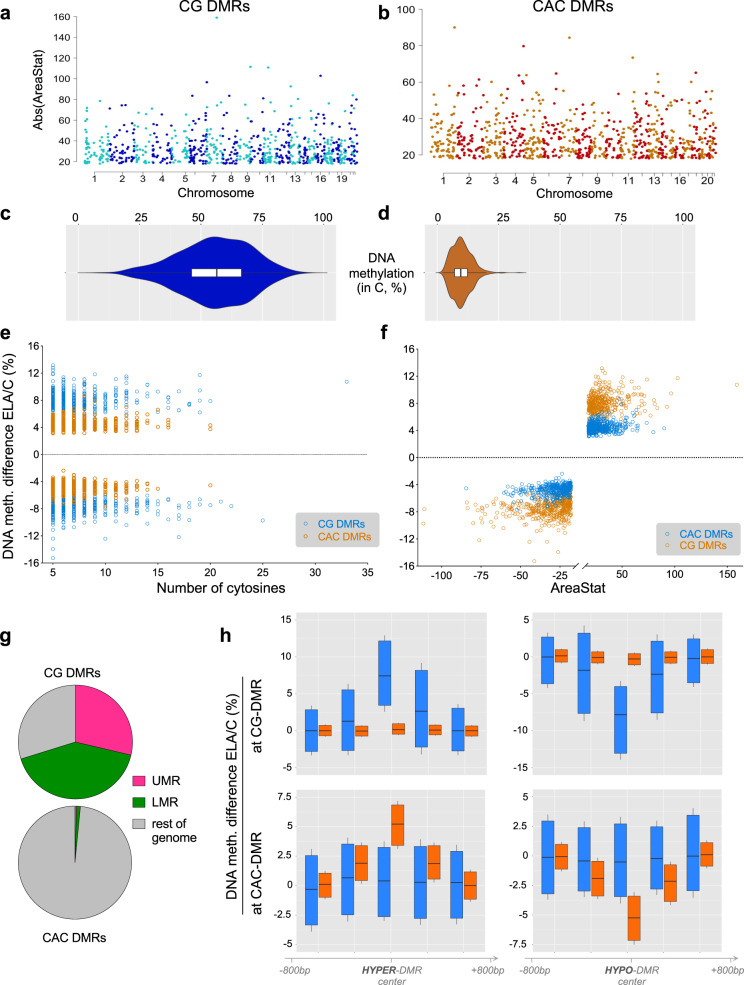
Fig. 5. Differential DNA methylation in the CG and CAC contexts in subjects with a history of early-life adversity (ELA).
a, b Manhattan plots of differentially methylated regions (DMR) identified using the BSmooth algorithm in the CG and CAC contexts, comparing control (C) and ELA groups. DMRs were identified separately in each context using the BSmooth algorithm37, with strictly similar parameters (see “Methods”). They were defined as regions of ≥5 clustered cytosines that each exhibited a significant difference in methylation (P < 0.001) and an absolute methylation difference ≥1% between groups. Surprisingly, as many DMRs were identified in the CAC context (n = 840) as in the canonical CG context (n = 795). c, d Methylation abundance in the C group in regions where DMRs were identified in the CG and CAC contexts (n = 840 CAC-DMRs, n = 795 CG-DMRs). CG-DMRs affected genomic sites showing a wide range of methylation levels (mean ± sem = 55.3 ± 0.5%), while CAC-DMRs occurred in lowly methylated regions (mean ± sem = 10.0 ± 0.1%), resulting in significantly different distributions (Mann–Whitney U test: U = 686; P < 0.0001). Box and violin plots show median and interquartile range (IQR), with whiskers representing 1.5 IQR. e DNA methylation differences observed in ELA subjects compared to the C group in CG- and CAC-DMRs, as a function of the number of cytosines composing each DMR. f DNA methylation differences observed in ELA subjects compared to the C group in CG- and CAC-DMRs, as a function of areaStat values, the measure of statistical significance of each DMR implemented by BSmooth. g Distinct distributions (chi-square test: χ2 = 884.3, df = 2, P < 1E-15) of CG- and CAC-DMRs among lowly methylated (LMR) and unmethylated (UMR) regions. h DNA methylation levels observed in CG and CAC contexts at DMRs (n = 840 CAC-DMRs, n = 795 CG-DMRs; raw, unsmoothed values) and flanking regions (+/− 1.2 kilobases, kb). No average difference in mCAC levels was observed among C and ELA groups at CG-DMRs (upper panels) that showed either increased (HYPER-DMR, left panels) or decreased (HYPO-DMR, right panels) levels of methylation in ELA subjects (and vice versa for CAC-DMRs, lower panels). Box plots show median and interquartile range, with whiskers representing 0.1 IQR. Source data are provided as a Source Data file.

