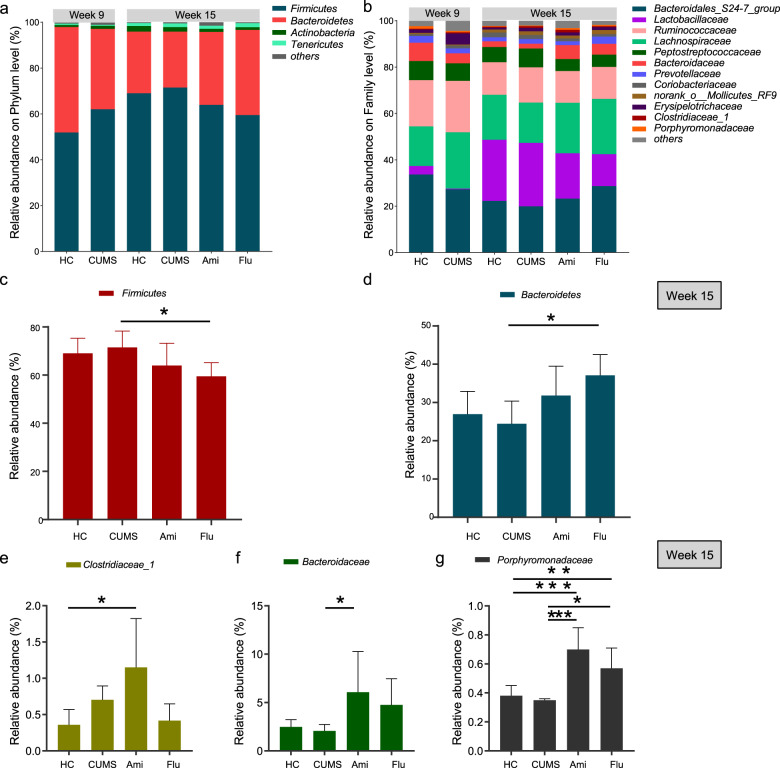
Fig. 3. Faecal microbiota changes following antidepressant treatments at the phylum and family levels.
Community bar-plot analysis shows the relative abundance of sequences at a the phylum and b family levels. OTUs comprising less than 1% at the phylum and family level of the total abundance are represented as ‘others’. Kruskal–Wallis H followed by Tukey’s posthoc tests statistics of the relative c, d bacterial phyla and e–g bacterial family abundances in HC, CUMS, Ami and Flu groups. Significant different are indicated: *P < 0.05, **P < 0.01, ***P < 0.001.

