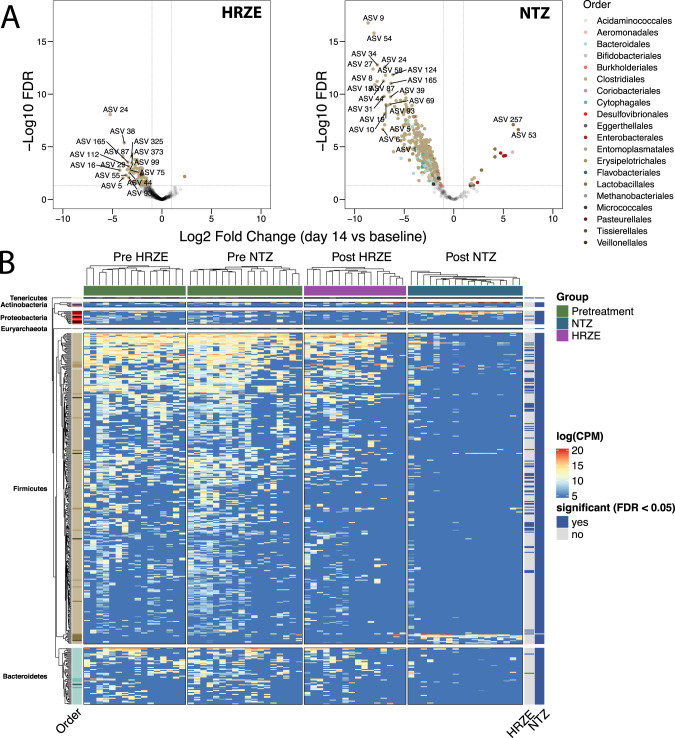
Fig. 3. Overlapping and distinct microbiome perturbation induced by NTZ and HRZE.
A Volcano plots indicating the post (day 14) vs pretreatment (baseline) differences at the ASV level for HRZE and NTZ. The color of each ASV is according to the phylogenetic Order. A single linear mixed effect model for each ASV of the form was fitted to determine differences due to treatment while accounting for sequencing batch and sex. ASVs significantly affected by the treatment were those determined to have a Benjamini-Hochberg false discovery rate (FDR) adjusted p-value less than 0.05 for the variable Group in the limma/voom model (see “Methods” section). The horizontal dotted lines indicate FDR < 0.05 and vertical dotted lines indicate |log2FC| > 1.5. B Within-arm unsupervised hierarchical clustering of the abundances of 404 ASVs found to be significantly affected by HRZE or NTZ treatment (FDR < 0.05, see Supplementary 5). The heatmap columns are split by arm membership (including baseline randomization group), and the heatmap rows are split by ASV phylogenetic Phylum, and within the Phylum, the Order is colored as in A. The right annotations (HRZE and NTZ) indicate whether each ASV was significantly perturbed by treatment. P value in y axis is adjusted according to Benjamini–Hochberg (FDR). Source data are provided as a Source Data file.

