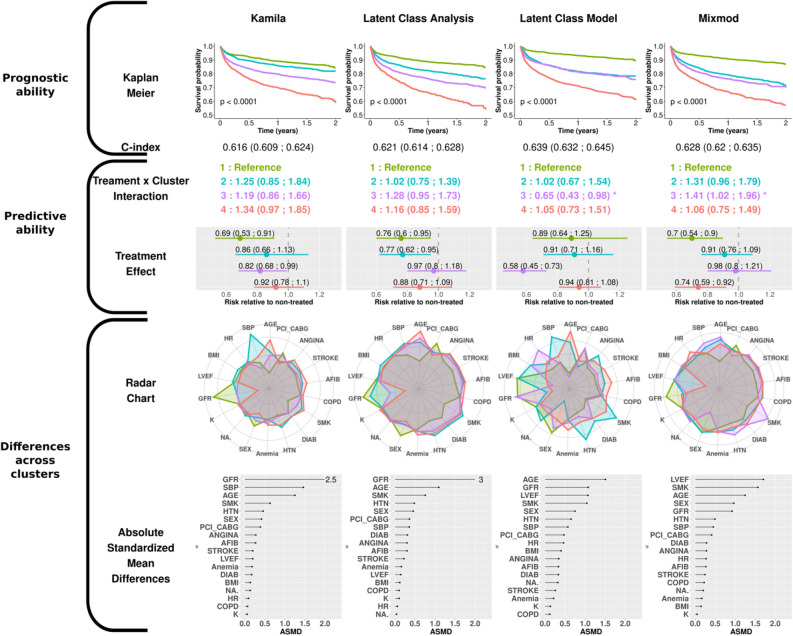
Figure 4.
Results obtained with the model-based clustering algorithms in the EPHESUS dataset. Radar charts were created from the means (per, by) group on scaled values (dichotomous and ordinal variables were coded numerically for convenience). The dot charts show the average Absolute Standardized Mean Difference (ASMD) over all clusters. This figure title was generated using R (R: A Language and Environment for Statistical Computing, R Core Team, R Foundation for Statistical Computing, Vienna, Austria, 2020, https://www.R-project.org).

