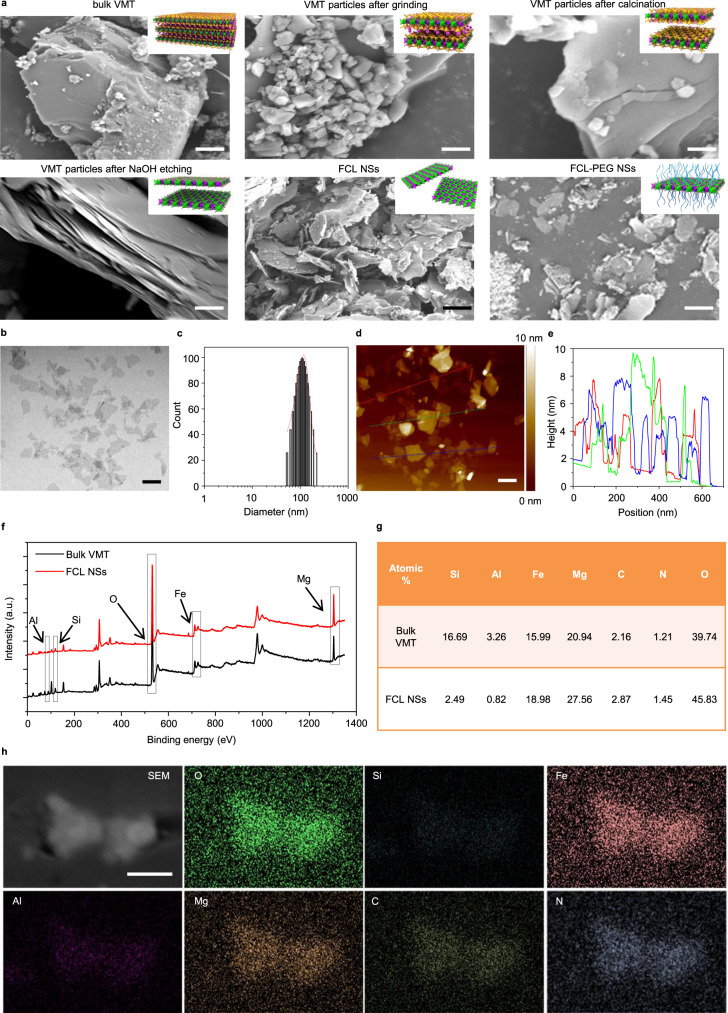
Fig. 2. Characterization of FCL-PEG NSs.
a SEM images of FCL-based NSs during their preparation: upper left—bulk VMT (scale bar 1 μm), upper middle—VMT particles after grinding (scale bar 1 μm), upper right—VMT particles after calcination (scale bar 100 nm), bottom left—VMT particles after NaOH etching (scale bar 100 nm), bottom middle—FCL NSs (scale bar 100 nm), and bottom right—FCL-PEG NSs (scale bar 100 nm). b TEM image (scale bar 100 nm), c size distribution, d AFM image (scale bar 100 nm), e thickness of FCL NSs, f XPS spectra, and g atomic percent of bulk VMT and FCL NSs, h SEM-EDX mapping images of FCL-PEG NSs (scale bar 100 nm for all panels). Three times each experiment was repeated independently with similar results in all these characterization figures. SEM scanning electron microscope, TEM transmission electron microscope, AFM atomic-force microscope, XPS X-ray photoelectron spectroscopy, EDX energy-dispersive X-ray detection.

