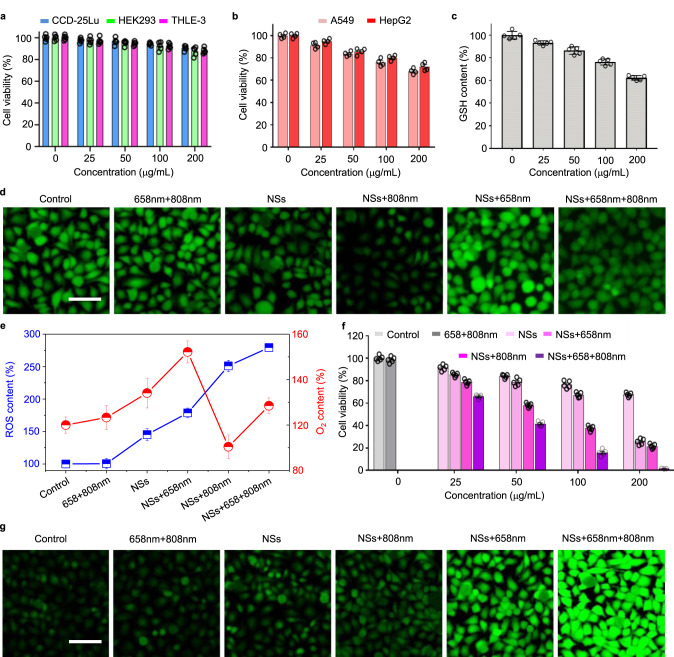
Fig. 5. In vitro photo-enhanced chemodynamic, photodynamic, and photothermal therapy.
a Normal (CCD-25Lu, HEK 293, and THLE-3) and b cancer cells (A549 and HepG2) viability treated with FCL-PEG NSs at different concentrations for 24 h. The data show mean ± s.d., n = 5 biologically independent cells. c GSH content of HepG2 cells treated with FCL-PEG NSs at different concentrations for 24 h. The data show mean ± s.d., n = 5 biologically independent cells. d CLSM images of O2 evolution of HepG2 cells treated with FCL-PEG NSs with or without 658 and 808 nm laser irradiation. Three times each experiment was repeated independently with similar results. e ROS and O2 content of HepG2 cells under different treatments. The data show mean ± s.d., n = 3 biologically independent cells. f CLSM images of ROS generation treated with FCL-PEG NSs with or without 658 and 808 nm laser irradiation. Three times each experiment was repeated independently with similar results in all these figures. g Antitumor effect of FCL-PEG NSs at different concentrations. The data show mean ± s.d., n = 5 biologically independent cells. Scale bars, 50 μm for all panels.

