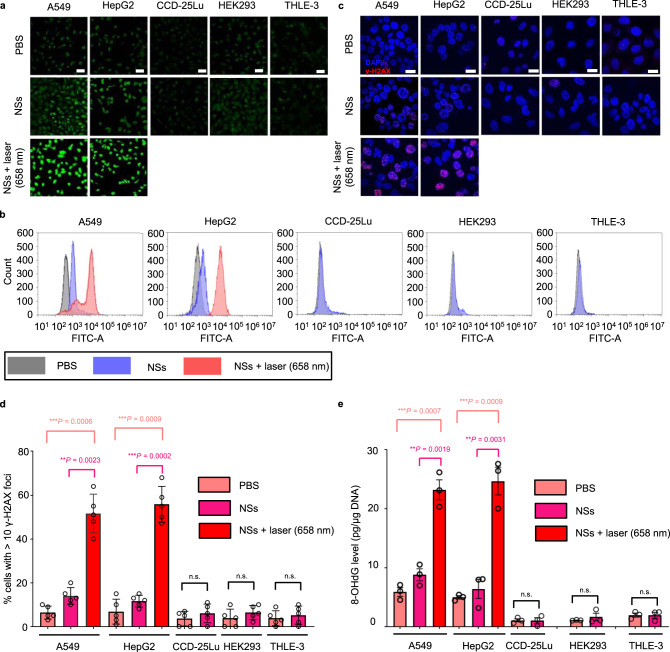
Fig. 8. In vitro toxicity.
a Representative confocal microscopy images (three times each experiment was repeated independently with similar results) and b flow cytometry detection of ROS contents from the different cancer cell lines and normal cell lines (scale bars, 50 μm) after different treatments (irradiation was performed only on cancer cells). c Representative confocal microscopy images of the different cancer cell lines and normal cell lines (scale bars, 50 μm) after different treatments. The nuclei were stained by DAPI (blue), and the γH2AX foci per nucleus were stained by anti-γH2AX antibody (red). Five times each experiment was repeated independently with similar results. d Quantification of the percentages of cells with >10 γH2AX foci numbers by confocal microscopy. The data show mean ± s.d., n = 5 biologically independent cells, and significance was determined using a two-tailed t-test (**P < 0.01, ***P < 0.001). e In vitro DNA damage of the cells after different treatments were measured by 8-OHdG assay. The data show mean ± s.d., n = 3 biologically independent cells, and significance was determined using a two-tailed t-test (**P < 0.01, ***P < 0.001).

