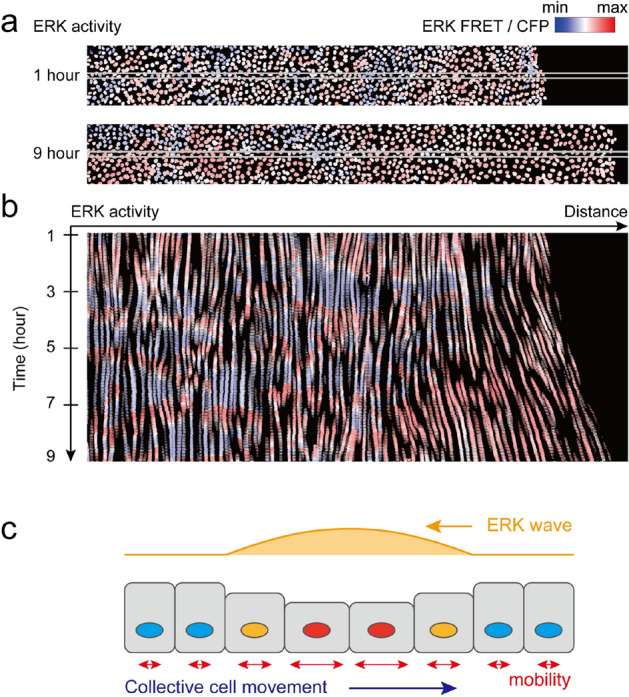
Figure 1.

Live imaging of ERK-induced collective cell migration (a). Visualization of ERK activity during wound-healing in epithelial MDCK cell sheet expressing the FRET-based biosensor of ERK. Snapshots are presented at 1 h (upper panel) and 9 h (lower panel) after scratching. Red and blue colors indicate high and low ERK activity, respectively. Note that the cytosol is not visualized, since the FRET-based biosensor is localized only in the nucleus6,10. (b) A kymograph of ERK activity images in a band region of interest indicated by the white box in (a). (c) A schematic representation of ERK-mediated collective cell migration. Cells migrate toward the opposite direction of the ERK wave. The cellular volume and mobility are increased by ERK activation.
