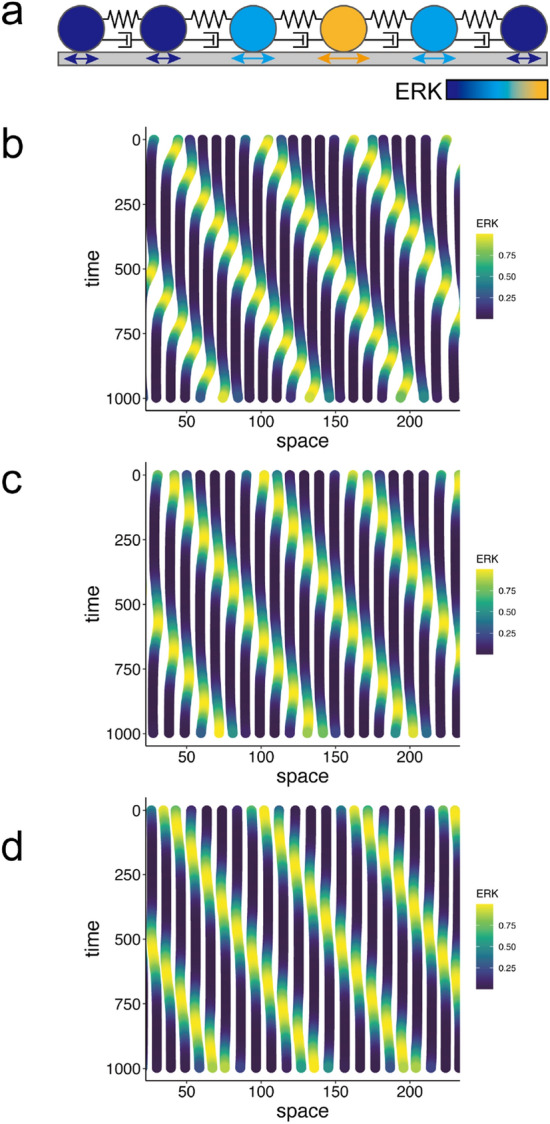
Figure 2.

Simulations of the particle-based model in 1D (a). Graphical representation of the particle-based model. The centers of cells are illustrated by particles, and these are connected with neighboring cells by springs and dampers representing the elasticity and viscosity of the cytoplasm, respectively. (b–d). Simulations of ERK-induced collective cell migration with different parameter settings. Each line indicates cellular trajectory with the line color representing ERK activity. Parameters in Table 1 were used. In (b), cells migrate toward the opposite direction of the ERK waves. In (c), cells show back-and-forth movement during the ERK waves without net displacement. In (d), cells migrate toward the same direction of the ERK waves.
