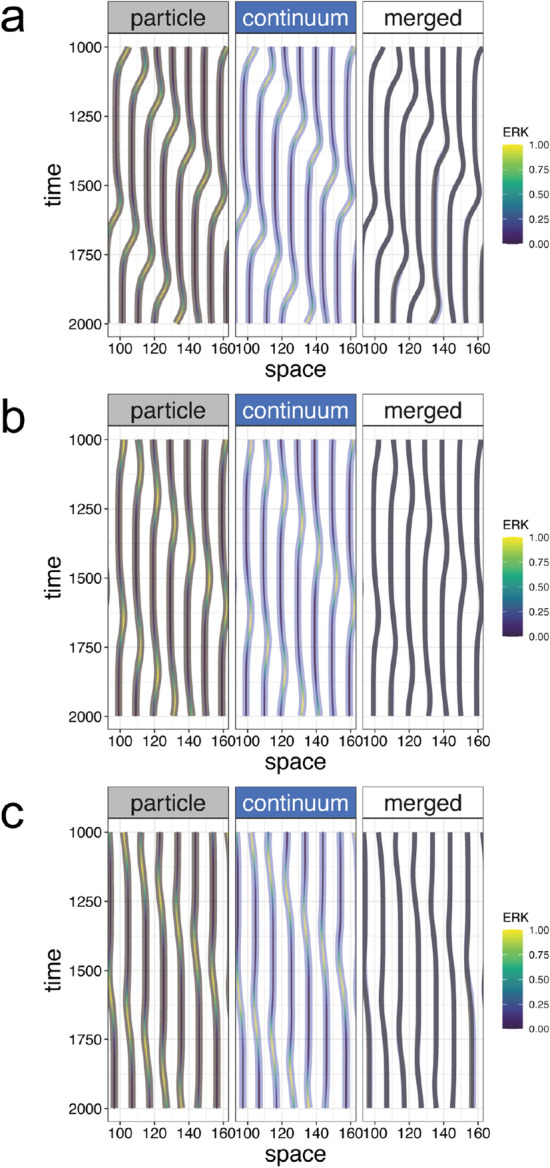
Figure 4.

Comparison between the particle-based and continuum models in 1D simulation Comparisons between the migration trajectories simulated by two models with the same parameter values. In the left and center panels, the shaded gray and blue lines indicate trajectories simulated by the particle-based and continuum models, respectively, and the color of the inner lines indicates ERK activity. In the right panels, the shaded gray and blue lines were merged for comparison. Parameters used in (a), (b), and (c) are the same as Fig. 2b–d, respectively.
