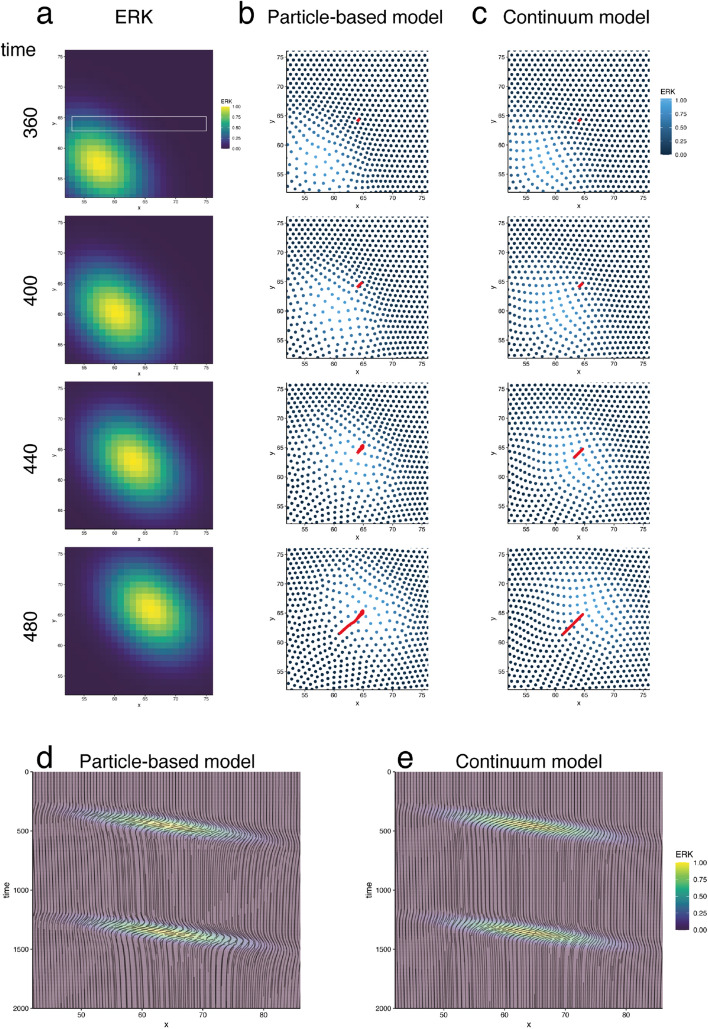
Figure 5.
Comparison between the particle-based and continuum models in 2D simulation (a). ERK wave applied in the simulations. (b,c). Simulation results in the particle-based and continuum models. Each dot represents cells in the particle-based model (b) and virtual marker simulated in the Lagrange description (c). Red lines indicate the trajectories of the cell (b) and virtual marker (c), which are initially located at the same position. See a supplemental movie for these simulations. (d,e). Trajectories of the simulated cells in space (x)—time coordinates in the particle-based (d) and continuum (e) models. Cellular migration trajectories within a white box region shown in (a).

