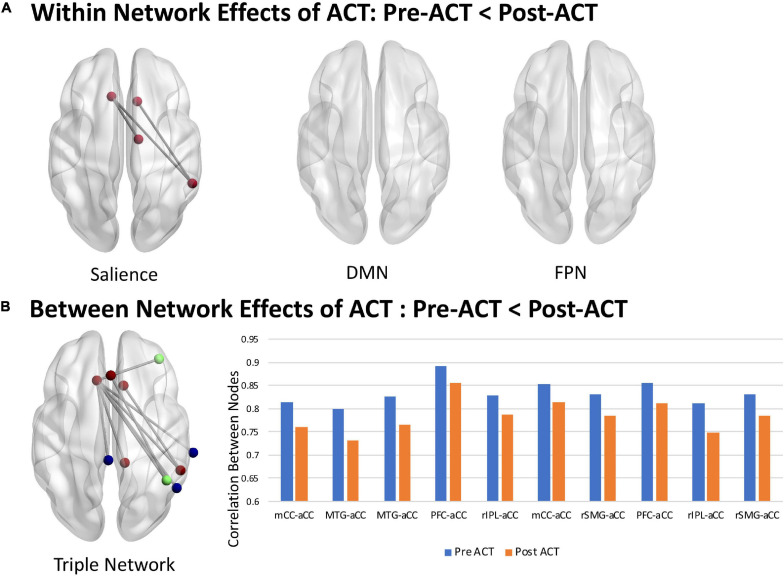
FIGURE 3.
Within and between network effects of ACT. (A) Within network decreases in FC following ACT: Pre-ACT < Post-ACT (t > 2.5, p = 0.039, 10,000 iterations). (B) Between network decreases in FC following ACT: Pre-ACT < Post-ACT (t > 2.5, p = 0.05, 10,000 iterations). Mean functional connections exhibiting ACT effects are shown for Pre-ACT (blue) and Post-ACT (orange). SN, DMN, and FPN nodes are shown in red, blue, and green, respectively. mCC, midcingulate cortex; aCC, anterior cingulate cortex; MTG, medial temporal gyrus; PFC, prefrontal cortex; rIPL, right inferior parietal cortex; rSMG, right superior medial gyrus. Node numbering below anatomical labels correspond to the node ordering in the Power Atlas (see Supplementary Material).

