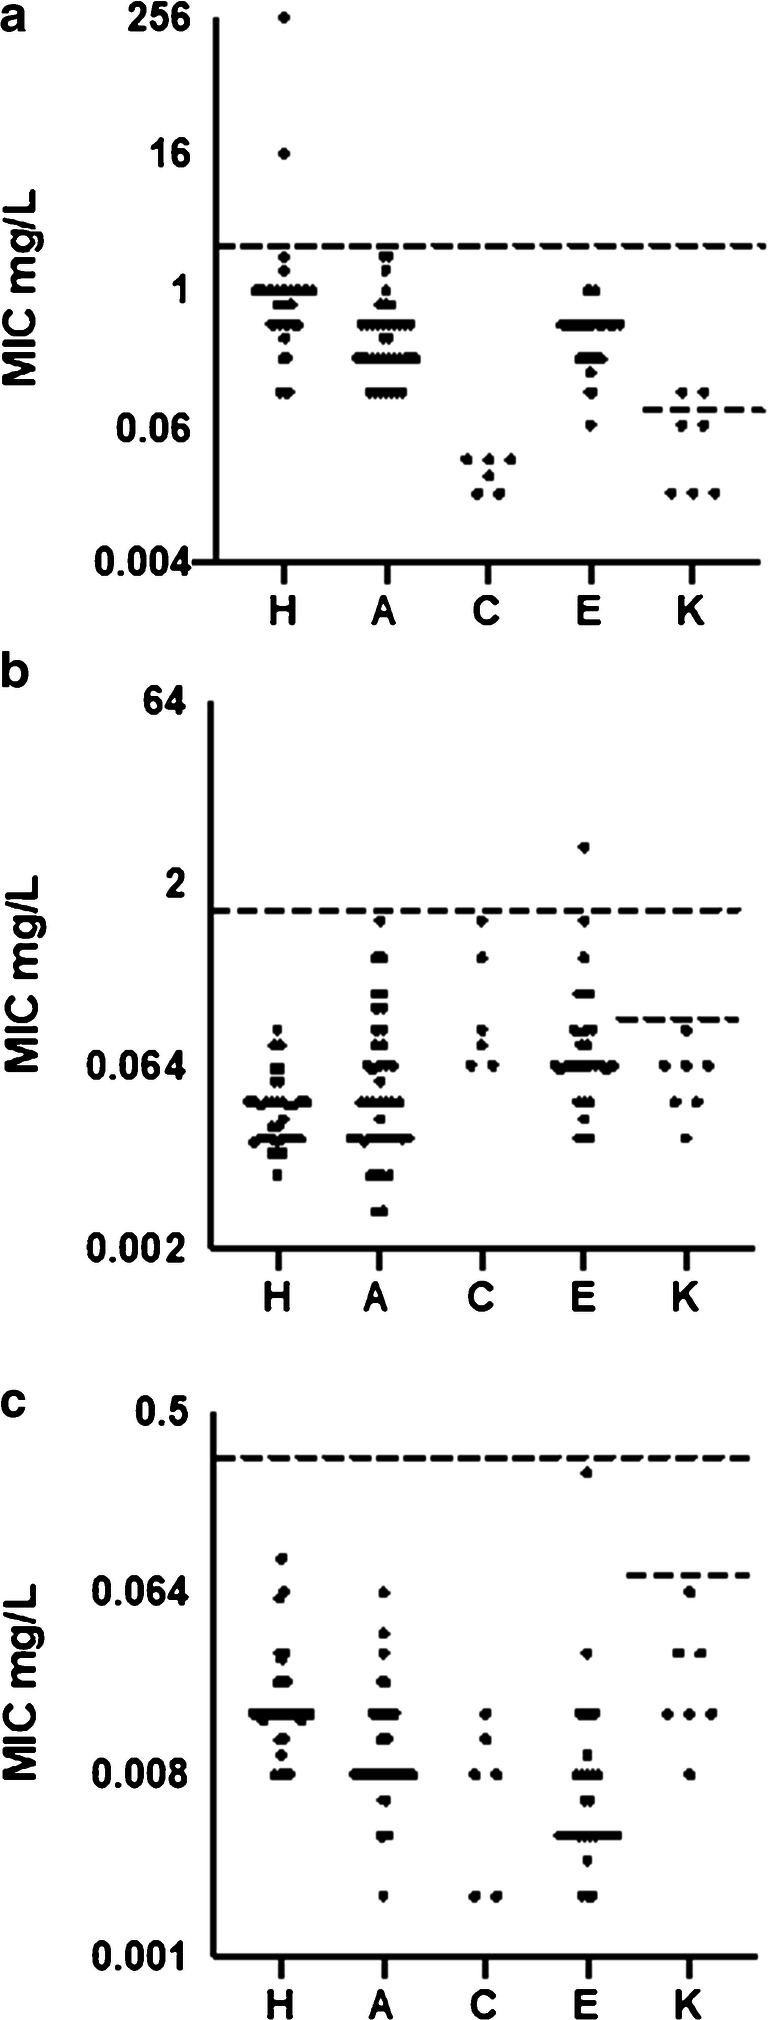
Fig. 2.

Distribution of MIC values for ampicillin (a), cefotaxime (b), and ciprofloxacin (c) for the isolates shown for each HACEK genus. The dashed lines represent the suggested cutoff, above which the isolate is regarded as resistant, according to EUCAST. The upper dashed line represents the EUCAST PK/PD breakpoints [21]. a Ampicillin 2 mg/L. b Cefotaxime 1 mg/L. c Ciprofloxacin 0.25 mg/L. The lower dashed line in column K represents the susceptibility break points for Kingella [22]. a Ampicillin 0.06 mg/L. b Cefotaxime 0.125 mg/L. c Ciprofloxacin 0.06 mg/L
