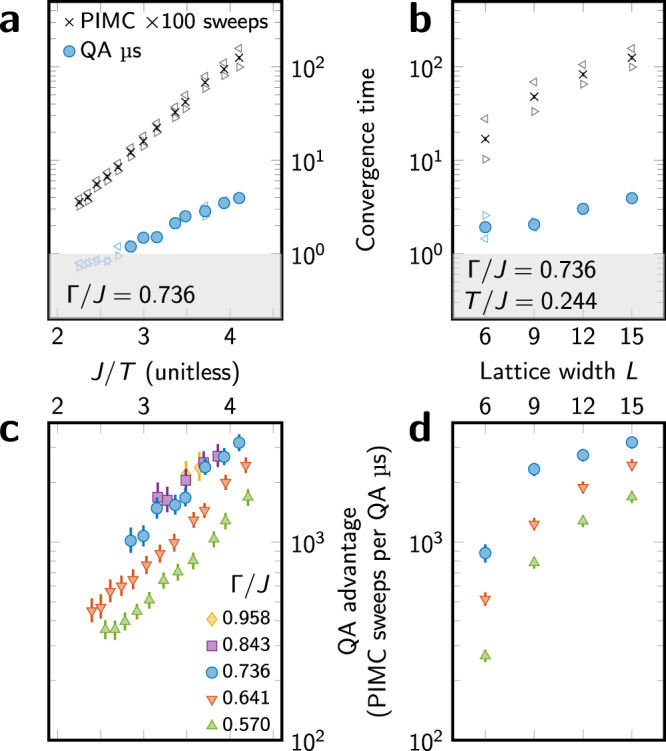
Fig. 4. Scaling of convergence time and QA speedup.

a, b Convergence time for both QA and PIMC as a function of inverse temperature J/T (a) and lattice width L (b). Triangles ⊲ and ⊳ indicate times for CCW and CW initial states, respectively; other markers indicate geometric mean. QA data are discarded if the estimate of is not accurate to within 0.03, or either CCW or CW convergence time is <1 μs (shaded region). c, d QA advantage over PIMC, given as the ratio of convergence times, increases as T decreases (c), as quantum fluctuations increase (c), and as system size increases (d). Temperatures shown in d are minimum for which QA results are accurate (J/T ≈ 4.2 in each case). Scaling in L (b, d) is given in terms of PIMC sweeps to show equilibration dynamics rather than computation time. All filled data points have 95% CI bootstrap error bars, often smaller than the marker. At Γ/J = 0.736, T/J = 0.244, QA equilibration is three million times faster than PIMC on a CPU (Supplementary Information).
