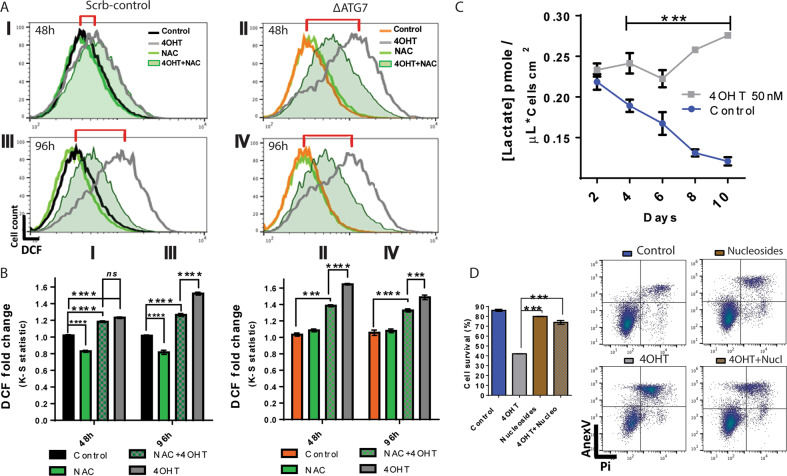
Fig. 7. Autophagy buffers the levels of ROS, reducing the DNA damage caused by oxidative species, hence increasing the survival of keratinocytes transitioning to a malignant transformed phenotype.
A Flow cytometry measurements of reactive oxygen species (ROS) through DCF fluorescence. Autophagy-competent (Scrb keratinocytes I–III) and autophagy-deficient keratinocytes (ΔATG7 keratinocytes II–IV) were induced with 50 nM 4OHT and treated with 5 mM NAC for 48 h (I, II) or 96 h (III, IV). The red brackets show the gradual increase in ROS levels in autophagy-competent cells and the fast increase of ROS levels in keratinocytes lacking autophagy. B ΔATG7 keratinocytes increase in 70% of their ROS levels after 48 h of HRasG12V induction. The levels in autophagy-competent keratinocytes were much lower (20%). In addition, NAC treatment reduced steady-state levels of ROS in noninduced keratinocytes. The dislocation of the fluorescent population was quantified by the Kolmogorov–Smirnov test (K–S). The graphs are representative of three independent experiments. C The conditioned culture media of ER:HRasG12V keratinocytes, 4OHT-induced and noninduced (control), were harvested for 10 days and had their lactate concentration measured. The graph is representative of two independent experiments carried out in triplicate. D The flow cytometry of cell viability assay stained with annexin-V/PI showed that deoxynucleoside treatment improved keratinocytes’ survival under oncogenic stress promoted by HRasG12V activity. The ER:HRasG12V keratinocytes were plated in lower density to extend as much as possible the experiment. After 6 days, the cells were induced with 50 nM 4OHT, treated with 2 mM deoxynucleosides (deoxyadenine, -guanosine, -cytidine, and thymidine) and their respective controls had their viability measured. The graph is representative of two independent experiments. The different font sizes represent the intensity of the effect. For flow cytometry, 30 × 103 cells were considered per condition and time point. Data presented as a mean (SD). Two-way ANOVA, *P ≤ 0.05, **P ≤ 0.01, and ***P ≤ 0.001, Bonferroni post hoc.

