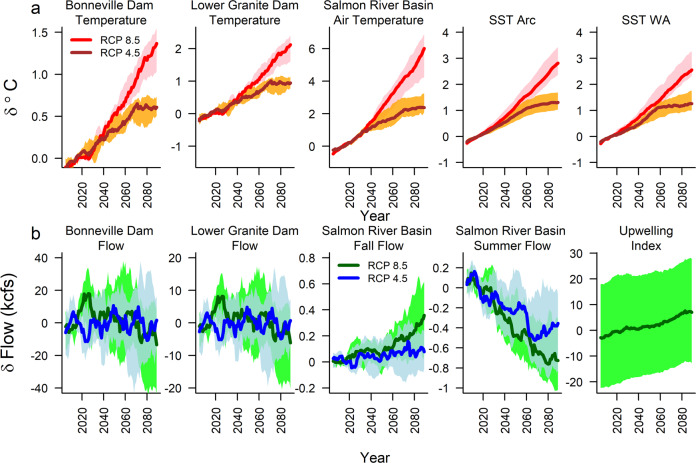
Fig. 2. Trends from global climate model projections used in climate scenarios.
Global climate model projections are shown for each covariate that influenced population outcomes. Lines show median projections across climate models for two representative concentration pathways (RCPs), while shading shows the range across projections from the 25th to 75th quantiles. a Temperature covariates are shown in red for RCP 8.5 and brown for RCP 4.5, while b flow covariates are shown in green for RCP 8.5 and blue for RCP 4.5. For sources, see Supplementary Table 1. Note that the coastal upwelling index has different units from other covariates112.

