
Fig. 7. Sensitivity analysis of the impact of climate change on individual life stages.
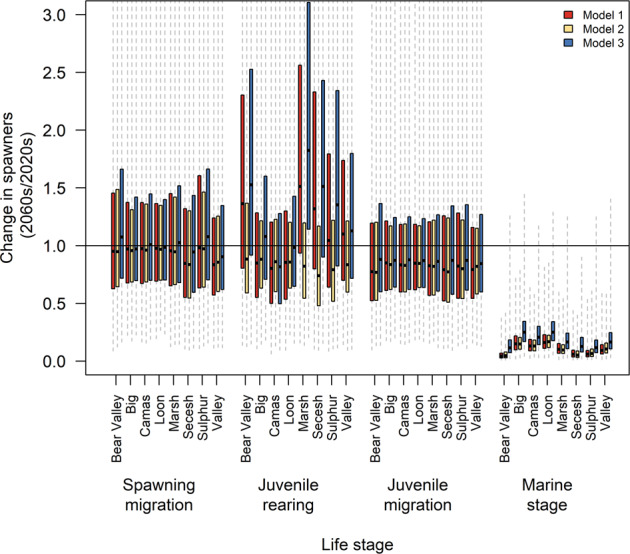
Results from a three‑by‑four factorial experimental design examining relative loss in spawner abundance from 2020 to 2060 due to climate‑change effects at four specific life stages. Net trends in population size are shown using the ratio of late abundance (2060–2069) compared with early abundance (2020–2029). Representative concentration pathway (RCP) 8.5 ensemble-mean climate trends were imposed at each life stage shown, with other life stages remaining under a detrended climate scenario. A value of 1.0 (horizontal line) indicates no change in spawner abundance. Boxes show the interquartile range across simulations, while the whiskers extend to the most extreme values of individual simulations. Horizontal lines show median values. Model 1 (red) covariates include sea surface temperature (SST), summer temperature, and fall flow; Model 2 (yellow) covariates include SST and summer flow; Model 3 (blue) covariates include SST, upwelling, summer temperature, and fall flow.