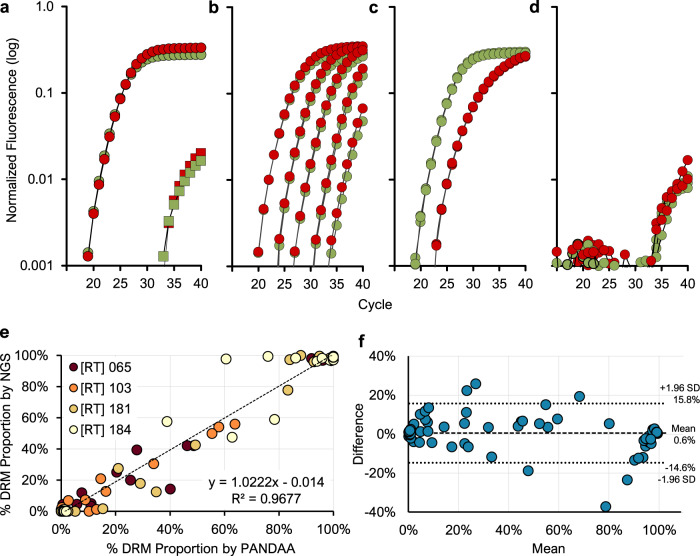
Fig. 5. Validation of PANDAA performance.
PANDAA with differentially labeled TaqMan probes to discriminate wild-type DNA (VIC-labeled [green]) from the K103N DRM (FAM-labeled [red]). a Using either 100% wild-type DNA or 100% mutant 014 template DNA at 105 copies per reaction, non-specific DRM signal (red squares) can clearly be differentiated from the specific wild-type signal (green circles) in wild-type only reactions. Similarly, the non-specific wild-type signal (green squares) are distinguishable from the specific K103 DRM signal (red circles). b PANDAA on 10-fold dilutions of a 1:1 mixture of 105 to 10 total DNA copies; thus, wild-type (green circles) and mutant DNA (red circles) were present at 50% of those quantities. c Mixed populations of wild-type (green) to mutant DNA (red), representing 10% K103N DRM at 105 total copies of DNA. d Negative control using human genomic DNA. Results are representative of a minimum of six replicates of each dilution series. The x-axis represents the number of qPCR cycles and the y-axis represents the log normalized fluorescence. e Correlation of PANDAA with NGS. Pearson’s correlation coefficient showed a strong agreement between the K65, K103N, Y181C, and M184VI DRM proportions quantified by PANDAA and those quantified by NGS (r = 0.9837; 95% CI: 0.9759–0.9890; P < 0.0001). f A Bland–Altman plot of the agreement between DRM quantification by PANDAA and NGS shows a mean bias of 0.6% (±7.8%) with 95% limits of agreement (dotted lines) ranging from −14.6% to 15.8%.

