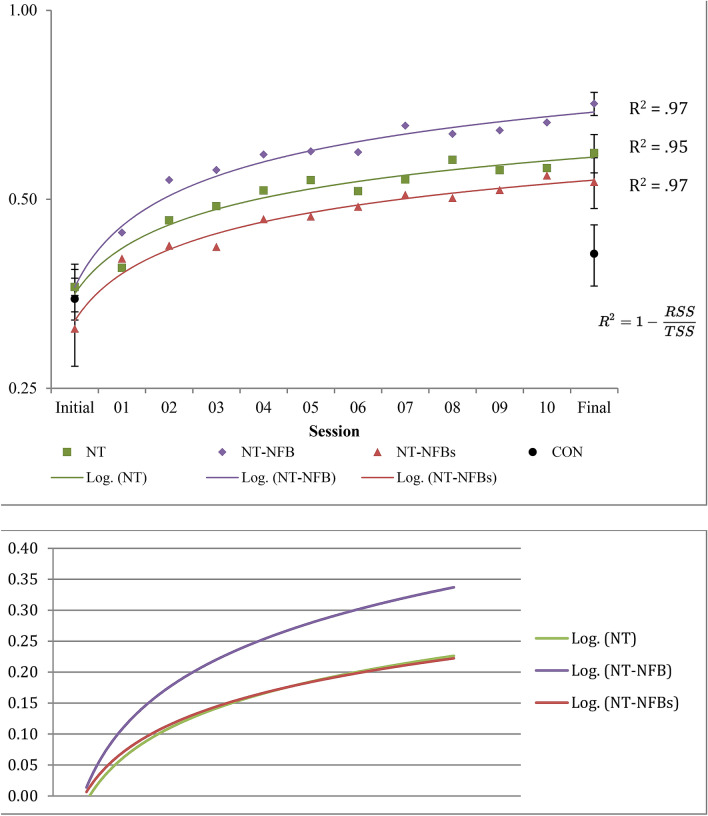
Figure 3.
3D-MOT Geometrical Speed Threshold Means on a log scale. Above: Error bars represent standard error and are only presented for Initial and Final sessions in order to maintain image clarity. Standard error for training trials varied between .03 and .05 for the NT group, .02 and .04 for the NT-NFB group, and .04 and .06 for the NT-NFBs group. Lines represent the log regression and the R2 corresponds to the amount of variance explained by the fit. (RSS = residual sum of squares, TSS = total sum of squares). Below: Normalized learning curves calculated by taking each individual session score and subtracting the baseline (initial session) score.

