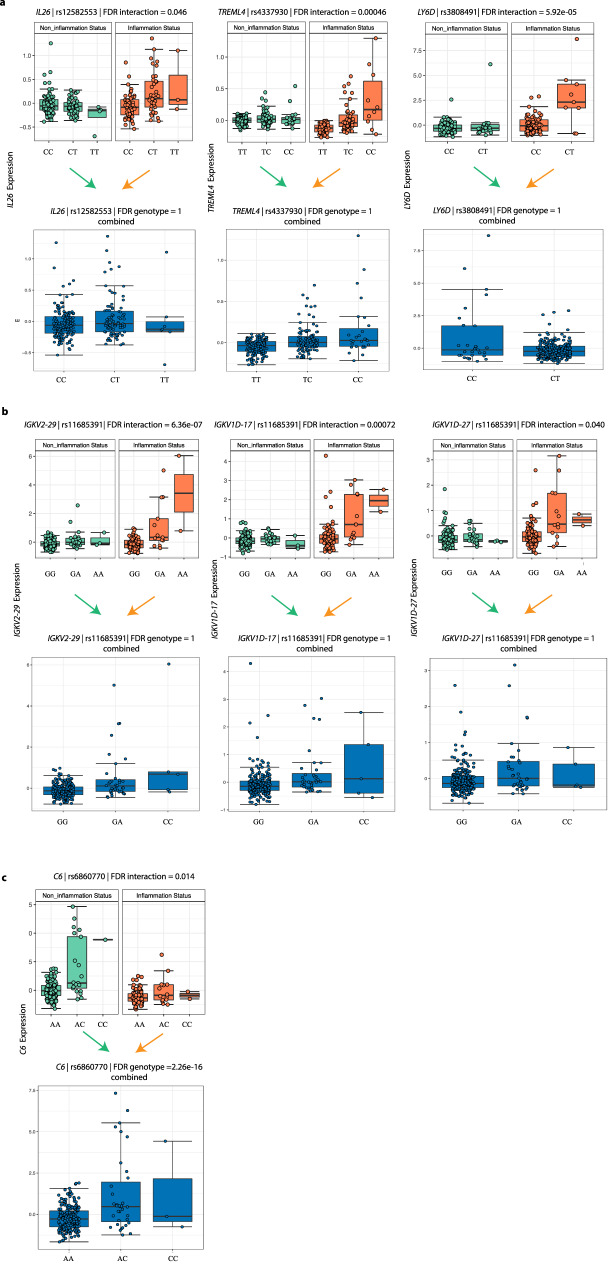
Fig. 1. Inflammation-dependent cis-eQTLs.
a Three examples of cis-eQTLs only driven by interaction, rs12582553-IL26 (linear regression, t test, FDRinteraction = 0.046), rs337930-TRENL4 (linear regression, t test, FDRinteraction = 0.00046) and rs3808491-LY6D (linear regression, t test, FDRinteraction = 5.92e − 05). Top panel: X-axis indicates the genotypes of the eSNPs stratified by inflammation status. Y-axis indicates the scaled expression levels of the eGenes. Bottom panel: X-axis indicates the genotypes of the eSNPs in all samples combined. Y-axis indicates scaled expression levels of the eGenes. b Three inflammation-dependent immunoglobulin cis-eQTLs. Panels are similar to (a). c One example of cis-eQTL driven by both genotype and the interaction, rs6860700-C6 (linear regression, t test, FDRinteraction = 0.014; FDRgenotype < 2.26e − 16). Box plots show medians and the first and third quartiles (the 25th and 75th percentiles), respectively. The upper and lower whiskers extend the largest and smallest value no further than 1.5 × IQR (n = 280 samples). Source data are provided as a Source Data file.

