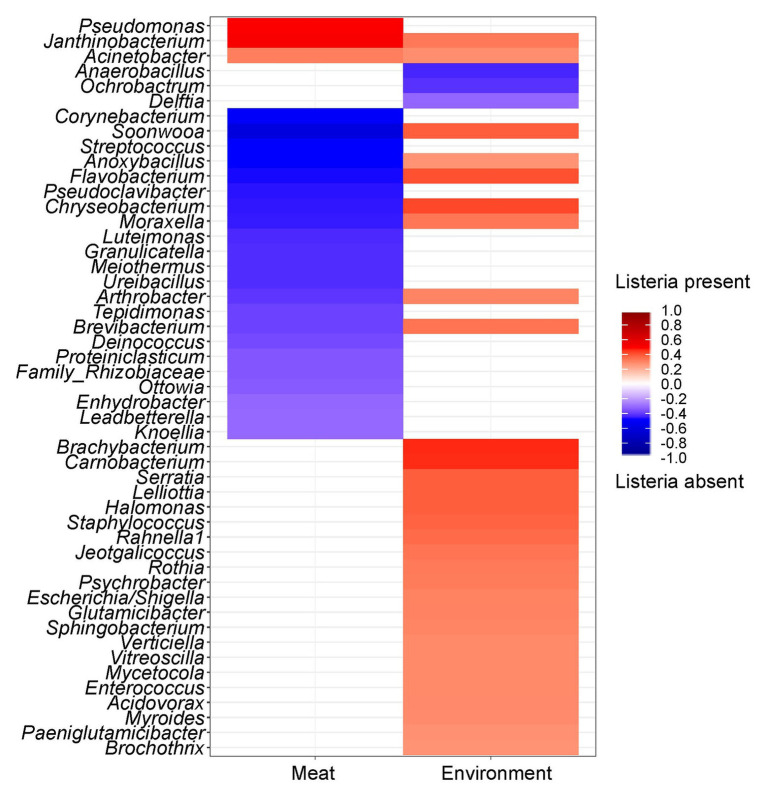
Figure 6.
Heatmap showing the correlation of individual genera between samples with or without listeria. Red color shows a positive correlation and blue color illustrates a negative correlation with the presence of listeria. The saturation of the color indicates the strength of the correlation coefficient. Only significant (p ≤ 0.05) taxa are shown.

