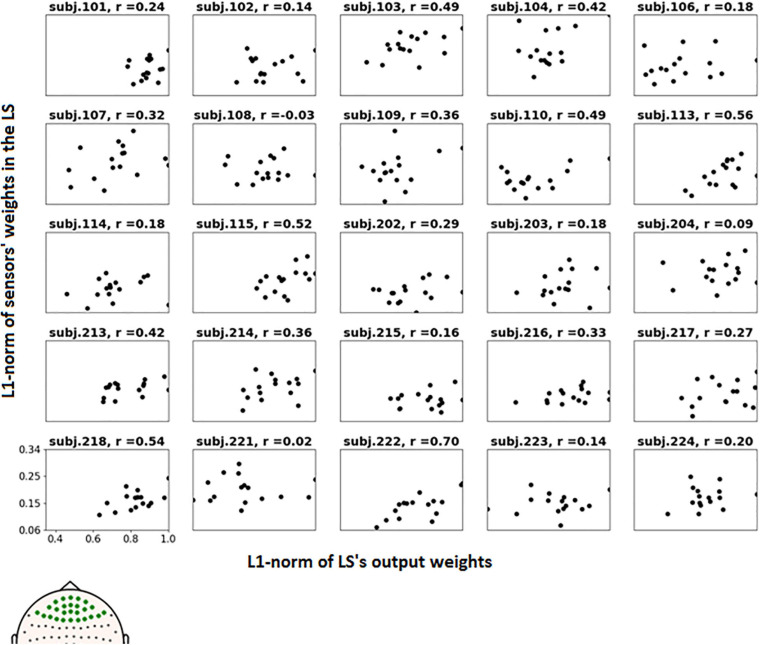
FIGURE 9.
Dependence of the L1-norm of LS frontal sensor weights on L1-norm of LS output weights for the voluntary class. Each picture corresponds to a single participant, dots correspond to LSs. Positions of the frontal sensors (presumably most vulnerable to the eye movement), whose weights were averaged, are shown in bold on the head map in the left bottom corner.

