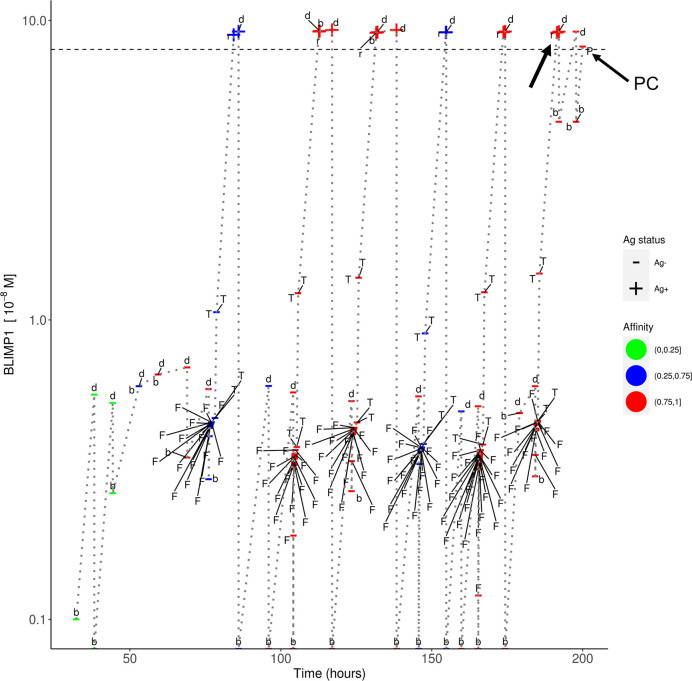
Figure 10.
Temporal dynamics of B-cell lineage for scenario 2, affinity-based CD40 signaling (simulation 4). The dotted lines traces the lineage of a single founder B_cell entering at the initial phase of the GC reaction up to a PC differentiation event at about 200 h. At each event (d, division; b, born, F, FDC contact; T, Tfh interaction; r, recycle to DZ; P, PC differentiation) the BLIMP1 level, Ag status (Ag+/Ag−), and affinity (low, medium high) is shown. The horizontal dotted line represents the BLIMP1 threshold for PC differentiation. CBs go through one or more cell divisions (d, b) before differentiating to CCs to have interaction with the FDC and Tfh cells. The affinity of the B-cells in this lineage shows an overall increase although SHM may also decrease affinity (red to blue color). Ag− cells are created from asymmetric division. BLIMP1 level varies in time as a result of transcriptional activity and (a)symmetric division. After interaction with a Tfh cell, the BLIMP1 level increases due to CD40 signaling. Asymmetric division may leave the BLIMP1 level unchanged or reduce it to 0. Symmetric division reduces the concentration with 50%. In this particular lineage we observe that a Ag+BLIMP1+ cell (indicated by the arrow) asymmetrically divides resulting in a Ag−BLIMP1− cell, which subsequently increases its BLIMP1 level again in subsequent divisions, and final differentiates to a PC (Ag−BLIMP1+).

