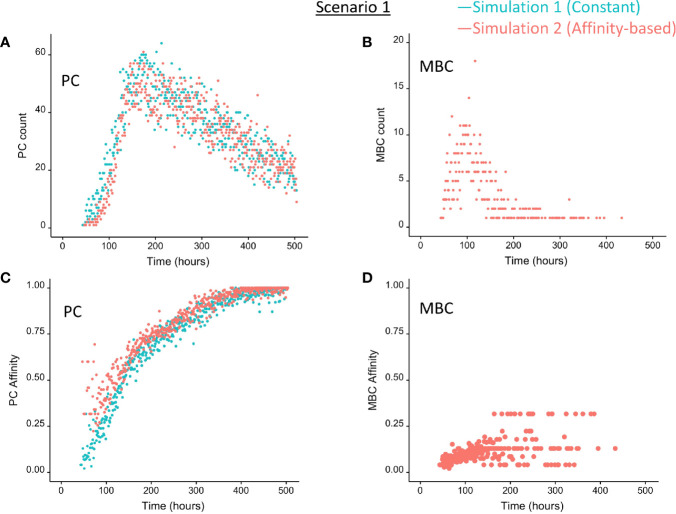
Figure 5.
Output cells for scenario 1 simulations with a constant CD40 signal (CD40 = 50; blue) or affinity-based CD40 signal (red). (A) Number of PCs, (B) number of MBCs, (C) PC affinity, and (D) MBC affinity during GC reaction. Post-simulation inspection of BLIMP1 levels of the output cells (Ag+) allows to discriminate between PCs (Ag+/BLIMP1+) and MBCs (Ag+/BLIMP1−). No MBCs are produced with a constant CD40 signal.

