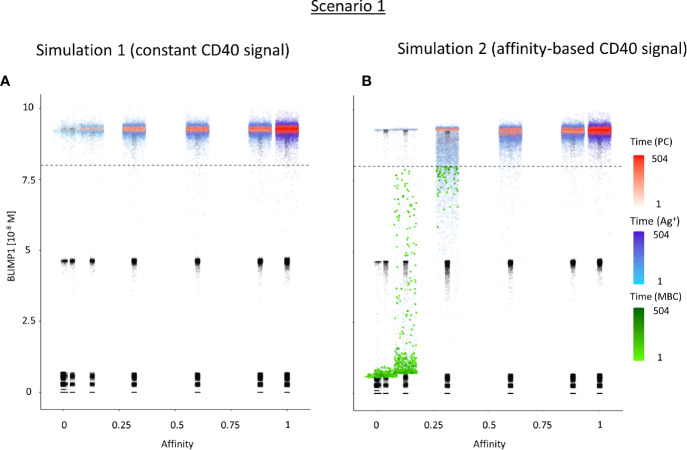
Figure 6.
Distribution of PCs, MBCs, and Ag+ (but not PC/MBC) cells with respect to their affinity, BLIMP1 level, and time of generation for scenario 1 simulations. (A) Simulation 1 with a constant CD40 signal (CD40 = 50). All output cells are PCs (no MBCs are generated). (B) Simulation 2 with an affinity-based CD40 signal. Output cells are mainly MBCs during the early GC reaction for B cells with affinity levels between 0 and 0.25. As the GC reaction progresses and B-cell affinity increases, BLIMP1 levels consequently rise above the threshold leading to a switch in the GC output towards mainly PCs for affinity levels between 0.25 and 1. Each dot represents a cell. Black dots represent cells other than PCs, MBCs, Ag+. Color gradient represents time from 1 to 504 h. Affinity assumes discrete values. Dotted line represents the BLIMP1 threshold (8 × 10⁻⁸M) for PC differentiation. Intermediate BLIMP1 levels arise mainly due to symmetric division of cells with high BLIMP1 level. Since values are recorded only in case of an event (e.g., cell division, Tfh interaction, differentiation) and because of steep curve of the BLIMP1 profile after Tfh-cell contact, BLIMP1 levels seem restricted to particular values but are not. Low and high BLIMP1 levels represent steady-states. Jittering of affinity values has been applied to prevent too many overlapping data points but causes some overlap of the lower affinity classes.

