
Figure 12.
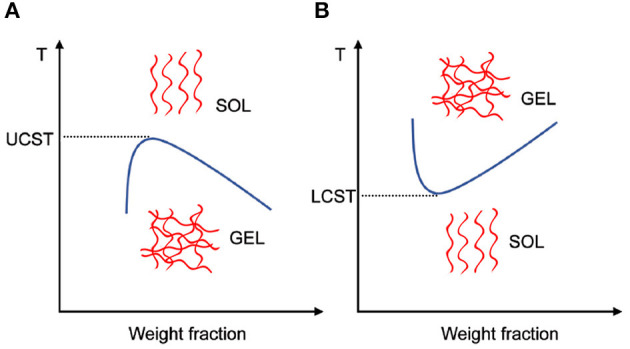
Schematic diagrams showing (A) UCST hydrogels and (B) LCST hydrogels experience gel–sol transition or sol–gel transition, respectively with an increased temperature. The blue lines represent the phase separation boundary.
Official websites use .gov
A
.gov website belongs to an official
government organization in the United States.
Secure .gov websites use HTTPS
A lock (
) or https:// means you've safely
connected to the .gov website. Share sensitive
information only on official, secure websites.
Schematic diagrams showing (A) UCST hydrogels and (B) LCST hydrogels experience gel–sol transition or sol–gel transition, respectively with an increased temperature. The blue lines represent the phase separation boundary.