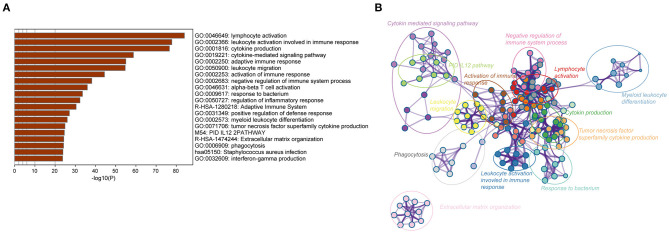
Figure 3.
Biological functions of the immune gene signature in GBM in the TCGA dataset. (A) Bar plot showing the top 20 terms derived from the gene set enrichment of risk score. The x-axis represents statistical significance. (B) The enrichment network plot visualizing the relationship between a set of representative terms. Each term is assigned with a unique color.

