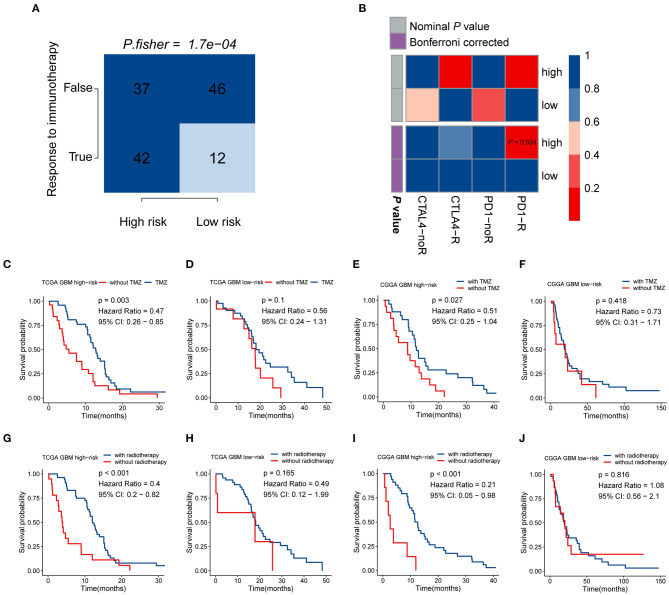
Figure 6.
The risk signature may be tightly associated with the responses of immunotherapy, chemotherapy, and radiotherapy. (A) Comparison of the predicted immunotherapeutic responses in different risk groups using the TIDE algorithm. P-value was obtained from Fisher's exact test. (B) The SubMap analysis concluded that high-risk patients might be more sensitive to anti-PD-1 immunotherapy. Patients from the high-risk group can benefit more from TMZ-based chemotherapy (C,D) and radiotherapy (G,H) in the TCGA GBM cohort, compared with those of the low-risk group. Similar responses to chemotherapy and radiotherapy were found in the CGGA RNA-seq GBM cohort (E,F,I,J).

