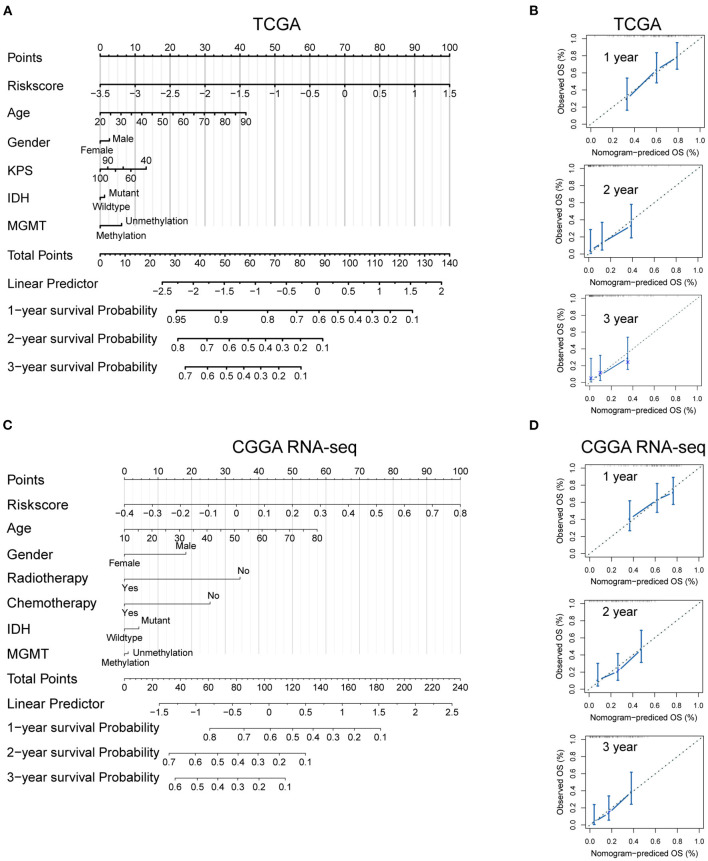
Figure 7.
Developed nomogram to predict the probability of survival in GBM patients. Nomogram built with clinicopathological factors incorporated estimating 1-, 2- and 3-year overall survival for GBM patients in the TCGA (A) and CGGA RNA-seq (C) cohorts. The calibration curves describing the consistency between predicted and observed overall survival at different time points in the TCGA (B) and CGGA RNA-seq (D) cohorts. The estimated survival was plotted on the x-axes, and the actual outcomes were plotted on the y-axes. The gray 45-degree dotted line represents an ideal calibration mode.

