Figure 8.
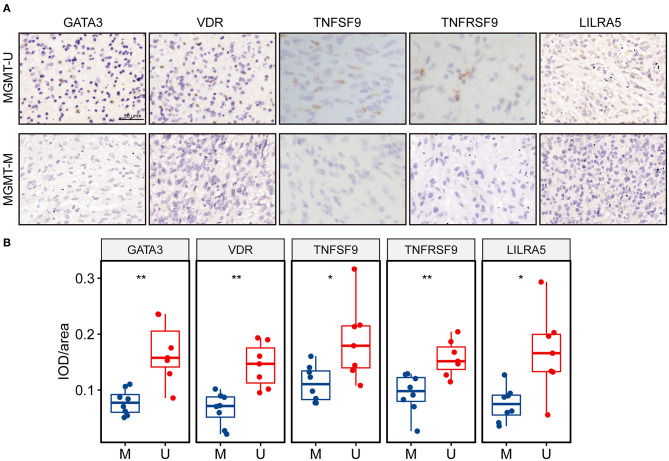
The protein expression levels of the genes in the risk signature were higher in MGMT-unmethylated GBM tissues. (A) Representative photographs of IHC staining for GATA3, VDR, TNFSF9, TNFRSF9, and LILRA5 in clinical GBM samples with MGMT methylation and unmethylation. Scale bar = 50 μm. (B) Boxplots showing the quantification of IHC staining intensity for each protein in the tumor samples. U represents MGMT-unmethylation, and M represents MGMT-methylation. *p < 0.05, **p < 0.01.

