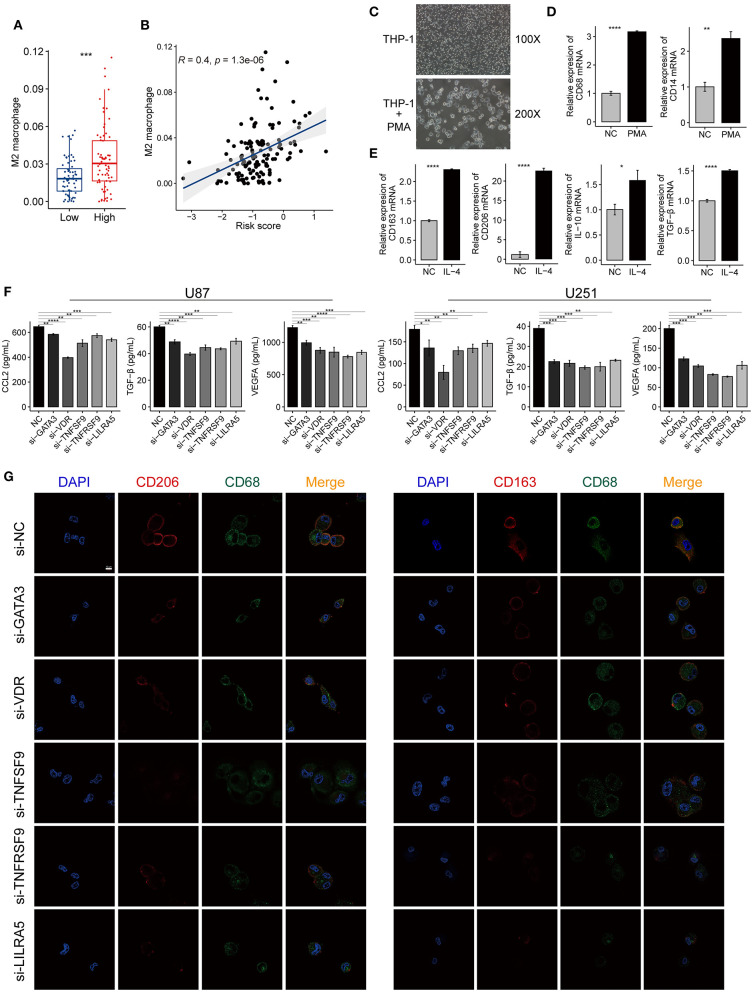
Figure 9.
The immune-gene based signature promotes the polarization of M2 macrophage in the tumor microenvironment of GBM. (A) A higher proportion of M2 macrophages was found in the high-risk group compared with the low-risk group. (B) The risk scores of TCGA-GBM samples were positively correlated with the contents of the M2 macrophage. The coefficient and P-value were calculated from the Pearson correlation analysis. (C) The morphological change implies the THP-1 cells differentiated into M0 macrophages after treated with PMA for 24 h. Magnification, ×100, and ×200. (D) The mRNA expression of macrophage markers (CD68, CD14) increased after PMA treatment. (E) The mRNA expression of M2 macrophage markers (CD163, CD206, IL-10, and TGF-β) increased after the induced macrophage treated with IL-4 for 24 h. (F) ELISA showing the level changes of the secreted immunosuppressive proteins (CCL2, VEGFA, and TGF-β) in the supernatant from GBM cells (U87, U251) after knocking down GATA3, VDR, TNFSF9, TNFRSF9, and LILRA5. (G) Immunofluorescence confocal microscopy of CD68, CD206, and CD163 in M2 macrophages. Red fluorescence indicates CD206 and CD163, green fluorescence indicates CD68, and blue fluorescence indicates DAPI staining of nuclear DNA. Scale bar = 50 μm. The data were presented as the mean ± SD; *p < 0.05, **p < 0.01, ***p < 0.001, ****p < 0.0001.

