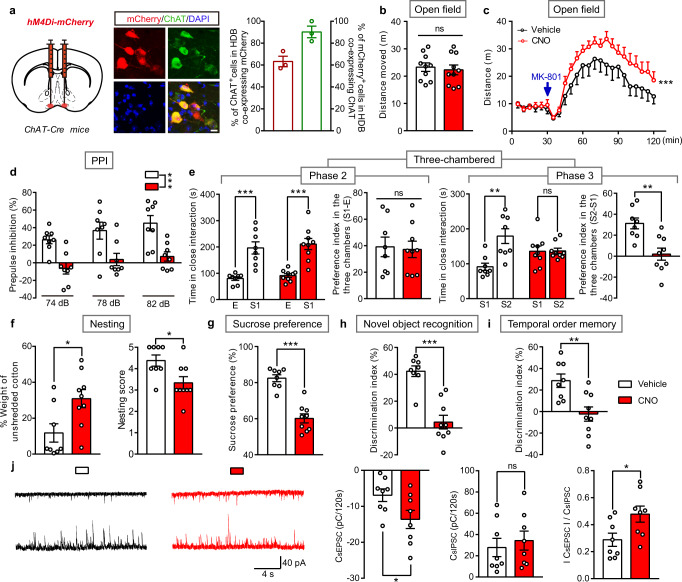
Fig. 6. Chemogenetic inhibition of cholinergic neurons in the BF induces sensorimotor gating ability deficit, social impairments, anhedonia-like behavior, and cognitive impairments, together with increased susceptibility to MK-801 induced hyperlocomotion.
a Schematic diagram of microinjection of AAV-EF1α-DIO-hM4Di-mCherry (hM4Di-mCherry) in the HDB of BF in ChAT-Cre mice, and representative images of hM4Di-mCherry expression in HDB ChAT+ cholinergic neurons. The percentage of ChAT+ cholinergic cells co-expressing mCherry and percentage of mCherry expressed in cells co-labeling ChAT were quantified. Scale bar, 10 μm. n = 3 mice. b–i Locomotion, sensorimotor gating, social behavior, hedonic function, and cognitive behavior in ChAT-Cre mice injected with hM4Di-mCherry in the HDB and treated with CNO or vehicle. b The cumulative distance traveled in the open field for 15 min in locomotion test. c The distance traveled in the open field for every 5 min was quantified and MK-801 was administrated 30 min after the free exploration phase. d Percentage of prepulse inhibition of the auditory startle reflex across different prepulse intensities. e Time in close interaction and preference index during sociability testing (phase 2), when exposed to a stranger mouse S1. Time in close interaction and preference index during subsequent social novelty recognition testing (phase 3), when exposed to a new stranger mouse S2 together with S1. f The percentage of the weight of unshredded cotton and nesting score in nest-building test. g Test for sucrose preference as a percentage of all fluid intake within a 48 h period. h Discrimination index in novel object recognition test. i Discrimination index in temporal order memory test. j Representative traces showing sEPSC (upper) and sIPSC (lower) recorded at –60 mV (upper) and +10 mV (lower) in the same mPFC layer 2/3 pyramidal cell from Vehicle (black) or CNO (red) mice. Quantification of sEPSC and sIPSC charge transfer and sEPSC/sIPSC charge transfer ratios in ChAT-Cre mice treated with CNO or vehicle. All data are presented as mean ± s.e.m. and error bars represent s.e.m. *P ≤ 0.05, **P ≤ 0.01, ***P ≤ 0.001, ns nonsignificant. See also Supplementary Data 2 for further statistical information. Source data are provided as a Source Data file.

