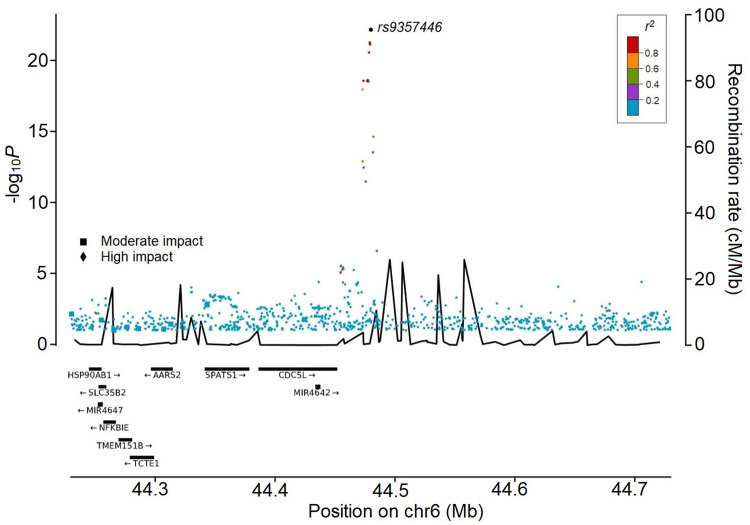
Figure 3.
Regional visualization of the Bell’s palsy meta-analysis. The leading variant is colored in black. Other variants are colored by the degree of correlation (r2) with rs9357446. The − log10 P-values on the left y-axis (two-sided logistic regression) are plotted for each variant against their chromosomal position (x-axis). The right y-axis shows calculated recombination rates based on the Icelandic data at the chromosomal location, plotted as solid black lines.

