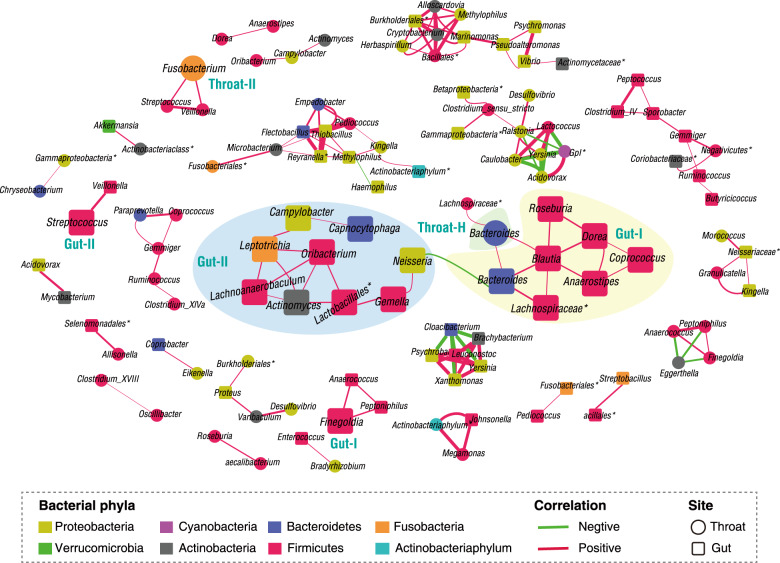
Fig. 5. Co-occurrence networks of gut and throat microbiota within 13 COVID-19 patients.
Pearson correlation was employed to calculate correlation coefficient (r) between bacterial genus pairs based on their relative abundances. Co-occurred pairs with r > 0.7 under FDR-adjusted P < 0.05 were shown and visualized by Cytoscape version 3.8.0. Edges were sized based on r values. The bigger squares or circles were indicators in Figs. 1d and 2d.

