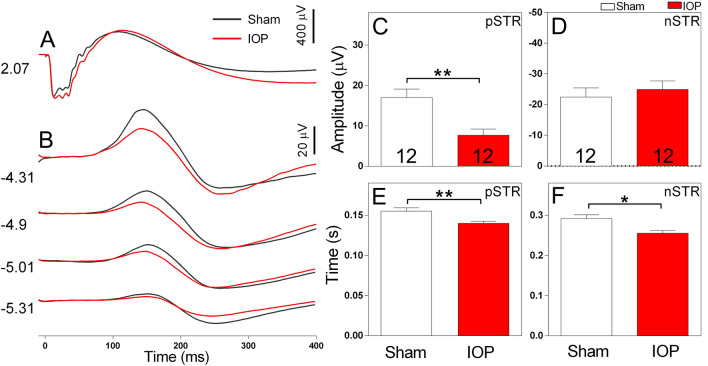
Figure 1.
Electroretinogram recordings of WT mice show a prominent reduction the pSTR amplitude (a measure of RGC activity) following acute IOP elevation. Representative waveforms of retinal responses measured at bright ((A), 2.07 log cd·s/m2) and dim ((B), − 5.31 to − 4.31 log cd·s/m2) luminous energies. Average amplitude of the pSTR (C) and nSTR (D) following sham (white bars) or elevated IOP (red bars). Average implicit time to the peak amplitude of the pSTR (E) or nSTR (F) following sham or elevated IOP treatment. The amplitude and implicit time of the pSTR was significantly reduced in eyes subject to elevated IOP. Numbers indicate the number of animals. *p < 0.05, **p < 0.01; paired t-test (sham vs IOP, within animal).

