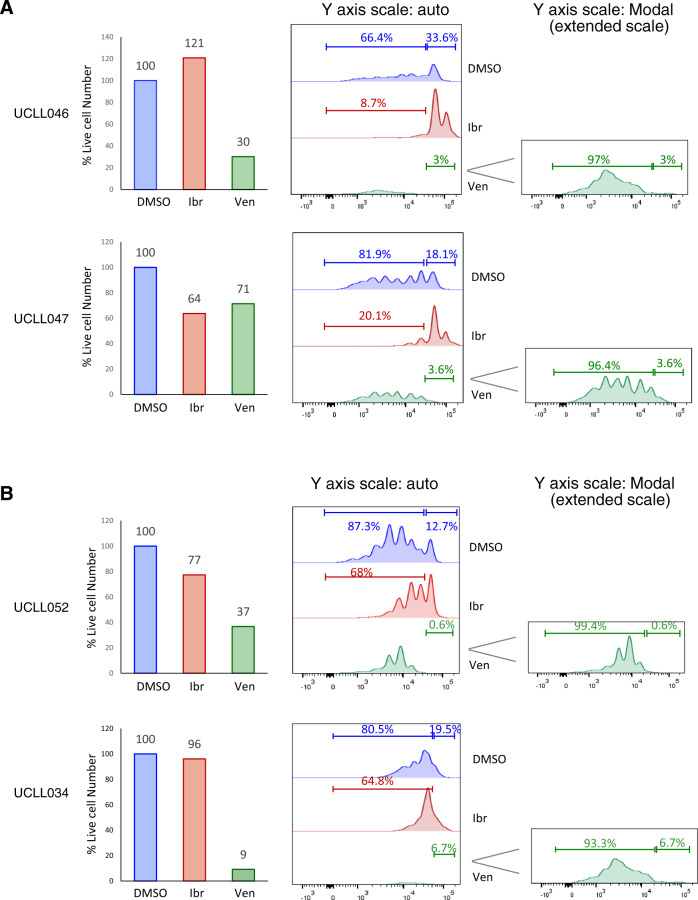
Fig. 3. The resting subpopulation of CLL, as opposed to the dividing one, preferentially responds to venetoclax.
CFSE-labeled CLL cells were cultured with BMF+CpG/IL-15 in the presence of DMSO, 400 nM of ibr or 200 nM of venetoclax (ven). All analyses shown were conducted at day 7 of the co-culture by flow cytometry. A Live cell numbers (bar graphs) and CFSE profiles of two ibrutinib naïve/sensitive cases. Live cell numbers were normalize to the DMSO control (100%). Percentage of cells distributed in the dividing phases of the CFSE profiles is automatically calculated by the FlowJo software. Y axis scale-auto displays events on the same scale for all treatment conditions, and Y axis scale-Modal displays events on an extended scale to show low peaks under the condition of ventoclax treatment. B Live cell numbers and CFSE profiles of two ibrutinib resistant cases.

