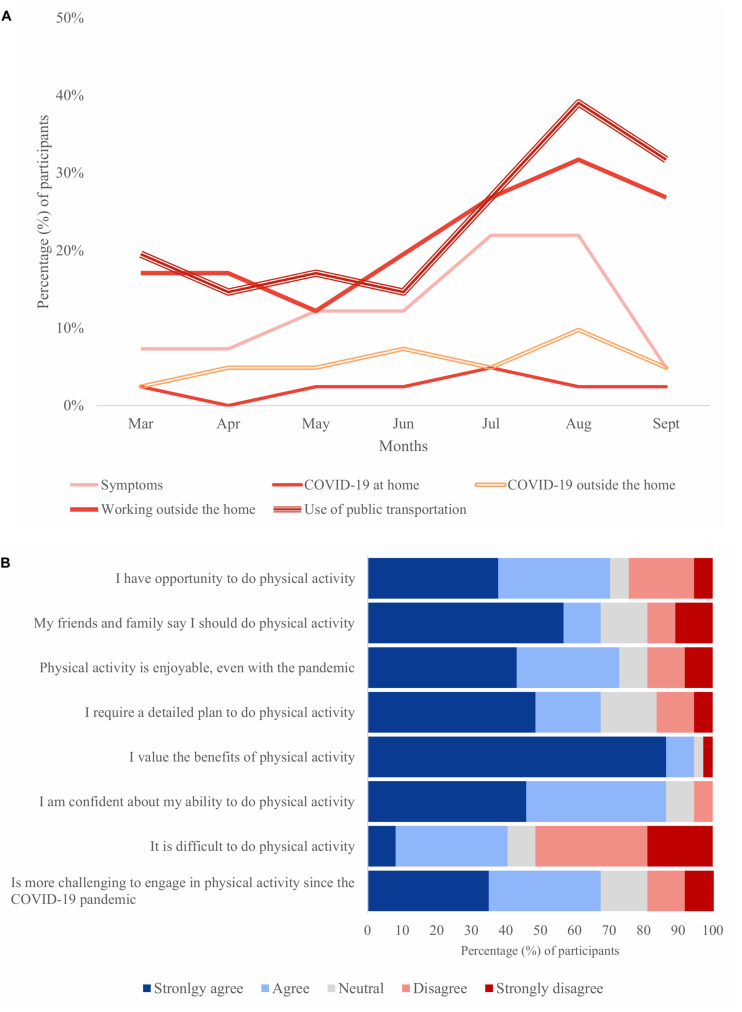
FIGURE 1.
Participants’ behavior outside and inside the home during the COVID-19 pandemic. (A) Proportion of participants who reported exposure, from March to September 2020, to suspected or confirmed cases of COVID-19 at home, outside the home, and who used public transportation (n = 37). (B) Barriers and facilitators for physical activity perceived in September 2020 (n = 37). Results are presented in percentage.

