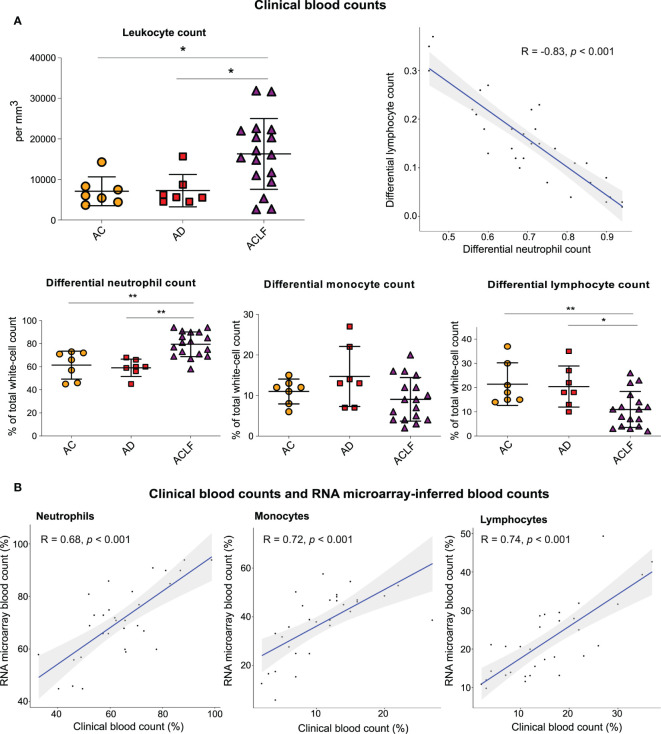
Figure 1.
Results of clinical blood counts and RNA microarray-inferred blood counts. (A) Clinical complete blood counts in three groups of patients with cirrhosis: AC (orange circles, n=7), AD (red square, n=7) and ACLF (purple triangle, n=17). P values were obtained using Kruskal–Wallis test and Mann–Whitney test. **P <0.01; *P <0.05. (B) Neutrophil, lymphocyte, and monocyte counts in paired clinical complete blood counts as compared with the CIBERSORT-inferred blood counts from RNA microarray data obtained with the use of peripheral blood (31 paired specimens). The shaded areas represent the 95% confidence intervals. AC denotes advanced cirrhosis, AD acute decompensation, and ACLF acute on chronic liver failure.

