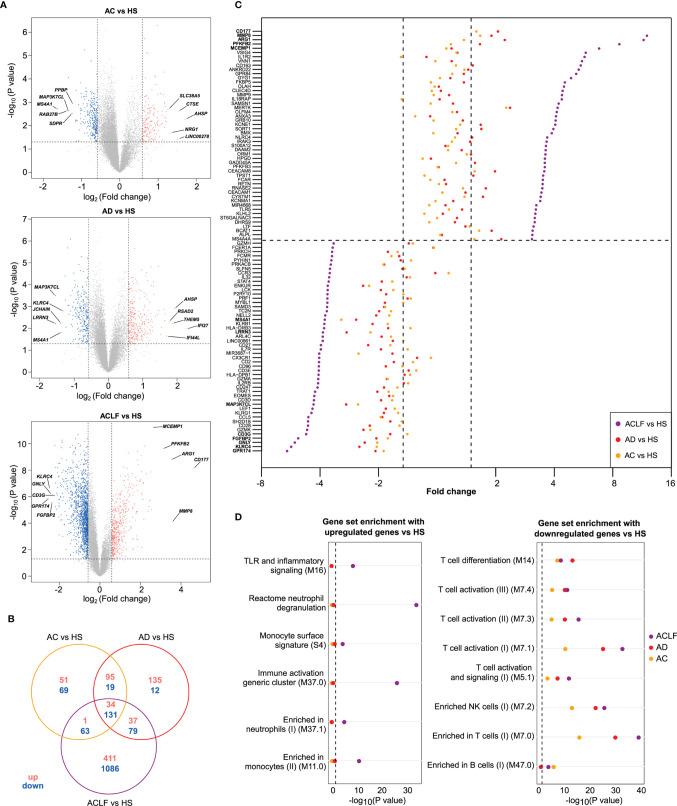
Figure 2.
Distinctive transcriptional characteristics of ACLF. (A) Volcano plots of differential gene expression between each patients’ group [AC (n=7); AD (n=7); ACLF (n=17)] relative to healthy subjects [HS (n=7)], with significance (−log10 P value) plotted against the log2 fold-change (patients:HS ratio). Genes were considered as differentially expressed when P was <0.05 (or −log10 P >1.3; dashed horizontal line) and fold-change >1.5 [or log2 fold-change >0.58 for upregulation or log2 fold-change <-0.58 for downregulation (right and left dashed vertical lines, respectively)]. Gray points indicate genes with no significant difference in expression, salmon indicates genes with significantly increased expression in patients and blue indicates genes with significantly decreased expression in patients. Representative differentially expressed genes are shown. CD177 was the most upregulated gene in ACLF versus HS. Between-group comparisons were performed using Student’s t-test. (B) Venn diagram showing the number of up- and downregulated genes that were unique or not to each of the three pairwise comparisons. (C) Cleveland plot showing the fold-changes for the 50 most upregulated genes in ACLF versus HS (top) and in the 50 most downregulated in this comparison (bottom). The dashed horizontal line separates upregulated genes from down regulated genes. For each gene, the fold-change of expression is also shown for two other pairwise comparisons: AD versus HS and AC versus HS. A dashed vertical line (right) indicates the threshold of 1.5 fold-change versus HS and the other dashed vertical line (left) indicates the threshold of -1.5 fold-change versus HS. (D) Results of enrichment analysis of predefined data sets (which, unless specified, were blood transcription modules (21)) with upregulated genes (left) and downregulated genes (right), both in ACLF versus HS. The enrichment of these gene sets with genes that were upregulated (left) or downregulated (right), in AC versus HS and AD versus HS genes, are also shown.

