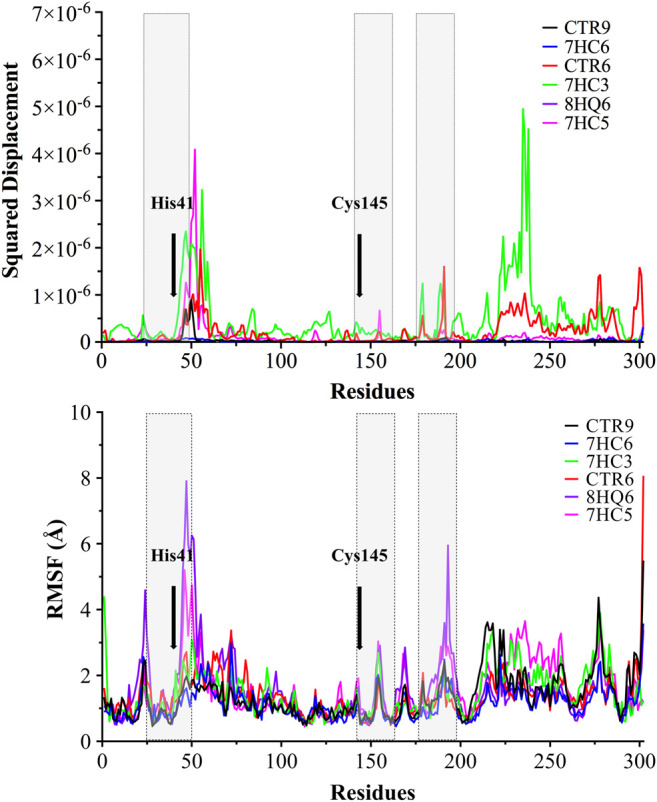
FIGURE 5.

Normal Mode Analysis and RMSF of the α-carbon. A main component analysis was carried out using the last 100 ns trajectories, and the main normal mode of movement was obtained. The displacement was plotted for each residue of SARS-CoV-2 Mpro in complex with CTR9, 7HC6, CTR6, 7HC3, 8HQ6 and 7HC5. In grey boxes represented pocket site residues. His41 and Cys145 residues of the catalytic site are highlighted with bold font.
