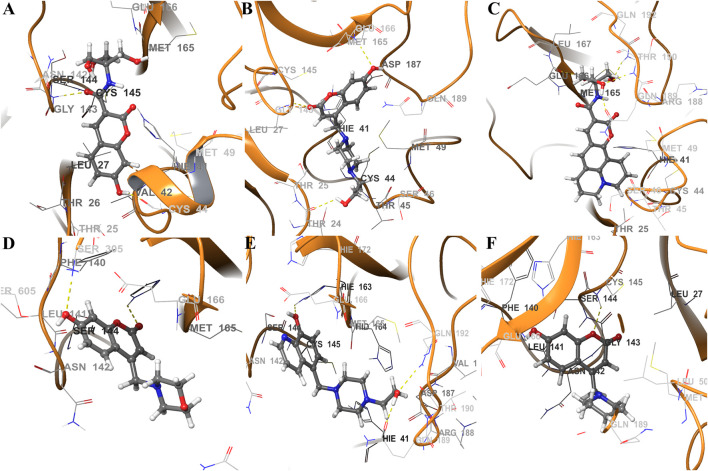
FIGURE 7.
Schematic representations of main component analysis of their respective production run for ligands (A) CTR9, (B) 7HC6, (C) CTR6, (D) 7HC3, (E) 8HQ6 and (F) 7HC5 bound to SARS-CoV-2 Mpro. The surrounding amino acid residues in the binding pocket of SARS-CoV-2 Mpro within 3Å from ligands. The yellow dotted line usually represents intermolecular interactions, like hydrogen bonds.

