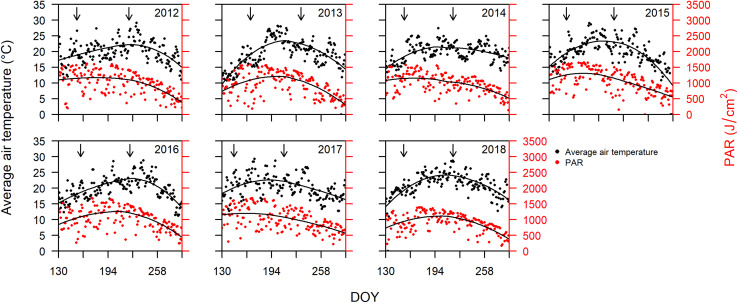
FIGURE 1.
Average daily air temperature (°C) on primary vertical axis, and photosynthetically active radiation (PAR; J cm–2) on the secondary vertical axis, plotted versus day of year (DOY) between DOY 130 and 290 for years 2012 through 2018. Arrows indicate dates of mid-flowering and mid-veraison averaged over all cultivars for each year. The solid lines represent LOESS (locally estimated scatterplot smoothing) fitted to the data for temperature and PAR.

