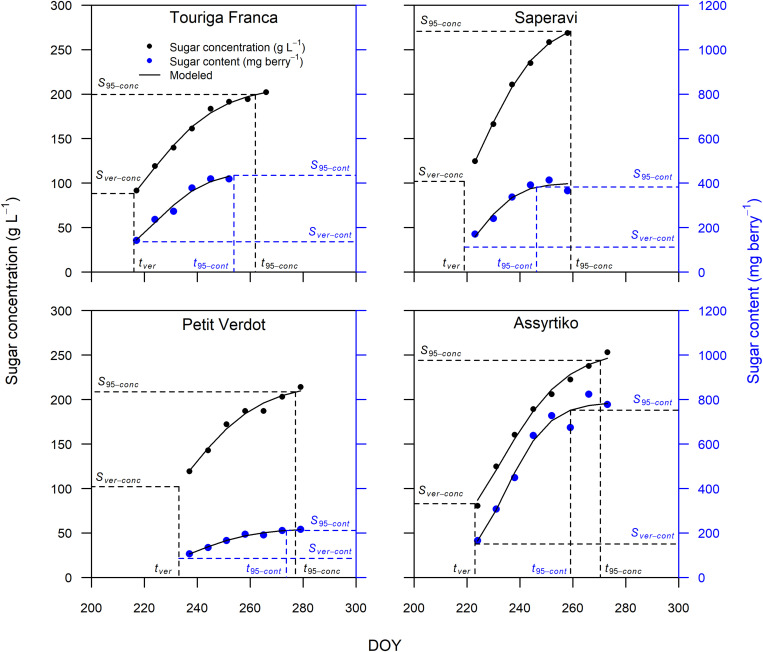
FIGURE 2.
Sugar accumulation data and fitted curves for Touriga Franca, Saperavi, Petit Verdot, and Assyrtiko expressed in both concentration (in black) and content (in blue) for 2016 (block 1). Vertical dashed lines identify tver and t95 concentration, or content. Horizontal dashed lines identify the corresponding sugar concentration (on primary vertical axis), or content (on secondary vertical axis).

