FIGURE 1.
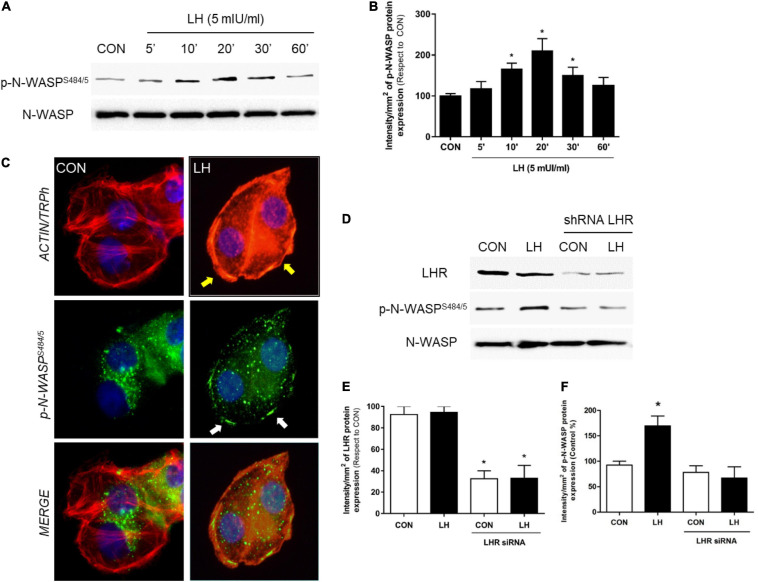
LH signals to LHR, enhancing N-WASP phosphorylation. (A) T-47D cells were treated for different times (0–60 min) with LH (5 mIU/ml). The total cell amounts of wild-type N-WASP and phosphorylated N-WASP (p-N-WASPS484/5) are shown by western blot analysis. (B) Phospho-N-WASP densitometry values were adjusted to N-WASP intensity and then normalized to the control sample. *P < 0.05 vs. control. (C) T-47D BC cells were treated with LH (5 mIU/ml) for 20 min. Cells were stained with phospho-N-WASPS484/5 linked to fluorescein isothiocyanate (FITC, green), actin fibers with Texas Red phalloidin (red), and nuclei were counterstained with DAPI. Yellow arrows indicate actinic cytoskeleton reorganization to the periphery of the cell membrane. White arrows indicate membrane-localized p-N-WASP. (D) T-47D BC cells were transfected with shRNA vs. LHR or with vehicle, and protein analyses for LHR, N-WASP, and phospho-N-WASPS484/855 were performed on cell lysates with or without treatment for 20 min with LH. The total cell amounts of wild-type LHR, N-WASP, and phospho-N-WASPS484/485 are shown by western blot. (E,F) LHR and phospho-N-WASP densitometry values were adjusted to N-WASP intensity and then normalized to the control sample. The results are expressed as the mean ± SD of the measurements. *P < 0.05 vs. CON, control. All experiments were performed in triplicate; representative images are shown.

