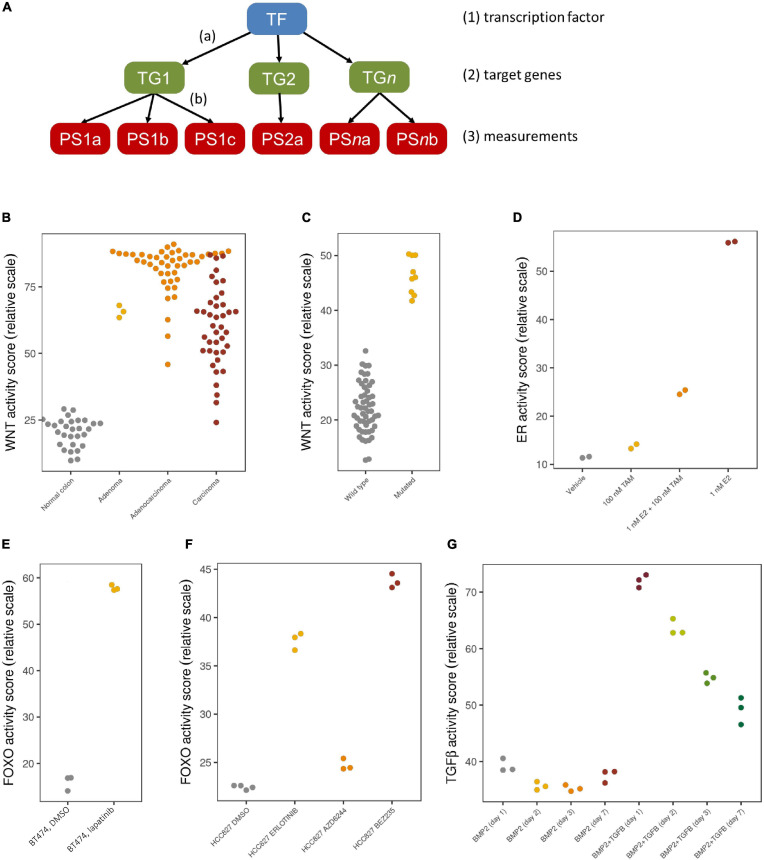
FIGURE 1.
Bayesian model and validation results. (A) The network structure of the Bayesian pathway model, with causal, probabilistic dependencies. (B–G) Validation results with pathway activity scores represented on a 0–100 scale; each dot is an individual sample. (B) Normal colon samples (gray) show a low Wnt pathway activity, while colon adenomas (yellow), adenocarcinomas (orange) and carcinomas (red) show a high Wnt pathway activity; microarray data from GSE20916. (C) Medulloblastoma samples with a driving CTNNB1 mutation (yellow) show a high Wnt activity, while other medulloblastoma samples (gray) show a low Wnt activity; microarray data from GSE10327. (D) ER pathway activity in MCF7 cell lines is low if treated with vehicle (gray) or only tamoxifen (yellow), high if treated with E2 (red), which is reduced again after adding tamoxifen (orange); microarray data from GSE53734. (E) FOXO activity is low in control BT474 cell lines (gray), indicating a high PI3K activity, but FOXO is high again (and PI3K low) after treatment with lapatinib (yellow); microarray data from GSE16179. (F) Quantitative differences in FOXO activity in HCC827 cell lines treated with DMSO (gray), erlotinib (yellow), AZD6244 (orange) and BEZ235 (red); microarray data from GSE51212. (G) Quantitative differences over the course of time (days 1, 2, 3, 7) without (first four groups) and with TGFβ stimulation (last four groups); microarray data from GSE84500.

