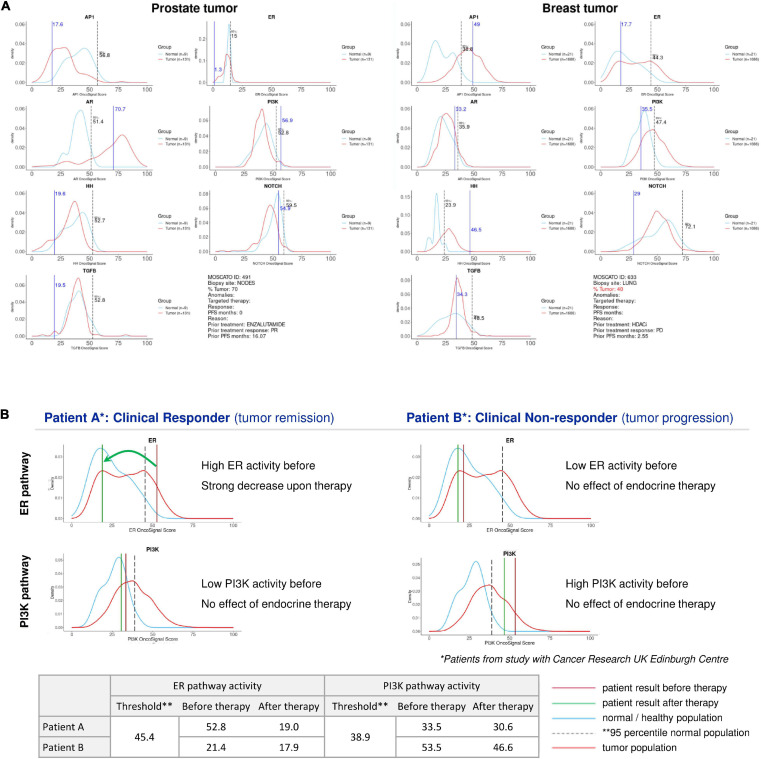
FIGURE 2.
Patient report for signaling pathway analysis with OncoSignal pathway activity tests. Visualized are for each signaling pathway the pathway activity distribution in healthy reference tissue (blue line) and in primary cancers originating from this tissue (prostate and breast) (red line); the dotted vertical line indicates the 95% confidence interval of normal pathway activity; the vertical blue line indicates the measured pathway activity in the analyzed patient tissue sample. If the blue line is located outside the (right) 95th percentile of normal, pathway activity is considered potentially tumor driving and targetable. (A) Examples of two individual patient samples from the EIT-PACMAN study (Martin et al., 2020), in which samples were analyzed from hard-to-treat patients from the MOSCATO study (Massard et al., 2017). For each patient pathway activity scores are shown for the ER, AR, PI3K, Hedgehog, MAPK-AP1, Notch, TGFβ pathways. Left: prostate cancer patient; right: breast cancer patient. For the prostate cancer patient (vertical line) the AR pathway activity score exceeded the 95th percentile of normal, while for prostate cancer in general AR pathway activity also exceeds the normal threshold (red line); consequently, the AR pathway was defined as a potentially targetable tumor driving pathway for this patient. Similarly, the ER pathway was abnormally active in the advanced breast cancer patient, providing a treatment target. (B) Example of two individual patient samples from Inda et al. (2020). For two patients with an ER positive breast cancer, ER (top) and PI3K (bottom) pathway activity scores are shown before (brown vertical line) and after (green vertical line) neoadjuvant hormonal aromatase inhibitor therapy. The left patient is a responder to hormonal therapy, and the increased ER pathway activity before therapy returned to normal during therapy. The right patient is a non-responder to hormonal therapy, and instead of the ER pathway, the PI3K pathway is the most likely tumor driving pathway. Below, the actual measured pathway activity scores are depicted.

